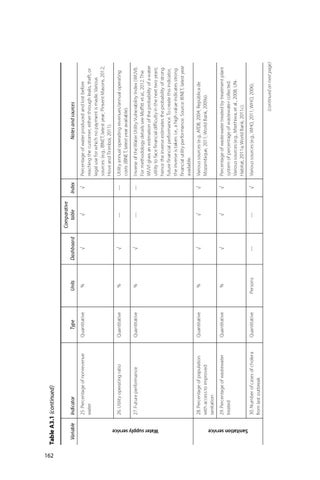
Variable
Quantitative
Quantitative
28. Percentage of population with access to improved sanitation
30. Number of cases of cholera from last outbreak
Quantitative
27. Future performance
Quantitative
Quantitative
26. Utility operating ratio
29. Percentage of wastewater treated
Quantitative
Type
25. Percentage of nonrevenue water
Indicator
Table A3.1 (continued)
Water supply service
Sanitation service
162 Persons
%
%
%
%
%
Units
—
√
√
√
√
√
Dashboard
—
√
√
—
—
√
Comparative table
√
√
√
—
—
√
Index
Notes and sources
(continued on next page)
Various sources (e.g., WHO, 2011; WHO, 2006).
Percentage of wastewater treated by treatment plant system of percentage of wastewater collected. Various sources (e.g., Mtethiwa, et al., 2008; UNHabitat, 2011a; World Bank, 2011c).
Various sources (e.g., AfDB, 2004; República de Mozambique, 2011; World Bank, 2009a).
Inverse of the Water Utility Vulnerability Index (WUVI). For methodology details see Moffitt et al., 2012. The WUVI gives an estimation of the probability of a water utility to face financial difficulty in the next two years; hence the inverse estimates the probability of strong future financial performance. To create this indicator, the inverse is taken: i.e., a high value indicates strong financial utility performance. Source: IBNET, latest year available.
Utility annual operating revenues/annual operating costs (IBNET, latest year available).
Percentage of water produced and lost before reaching the customer, either through leaks, theft, or legal use for which no payment is made. Various sources: (e.g., IBNET, latest year; Pinsent Masons, 2012; Hove and Tirimboi, 2011).