161
Variable
Quantitative
Quantitative
Quantitative
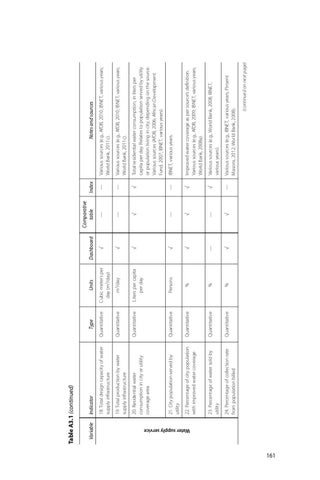
22. Percentage of city population with improved water coverage
23. Percentage of water sold by utility
24. Percentage of collection rate from population billed
Quantitative
20. Residential water consumption in city or utility coverage area
Quantitative
Quantitative
19. Total production by water supply infrastructure
21. City population served by utility
Quantitative
Type
18. Total design capacity of water supply infrastructure
Indicator
Table A3.1 (continued)
Water supply service
%
%
%
Persons
√
—
√
√
√
√
m3/day Liters per capita per day
—
√
Cubic meters per day (m3/day)
√
—
√
—
√
—
Comparative table
Dashboard
Units
—
√
√
—
√
—
—
Index
Notes and sources
(continued on next page)
Various sources (e.g., IBNET, various years; Pinsent Masons, 2012; World Bank, 2008).
Various sources (e.g., World Bank, 2008; IBNET, various years).
Improved water coverage as per source’s definition. Various sources (e.g., AfDB, 2009; IBNET, various years; World Bank, 2008a).
IBNET, various years.
Total residential water consumption, in liters per capita per day. Relates to population served by utility or population living in city, depending on the source. Various sources (AfDB, 2006; African Development Fund, 2007; IBNET, various years).
Various sources (e.g., AfDB, 2010; IBNET, various years; World Bank, 2011c).
Various sources (e.g., AfDB, 2010; IBNET, various years; World Bank, 2011c).