159
Variable
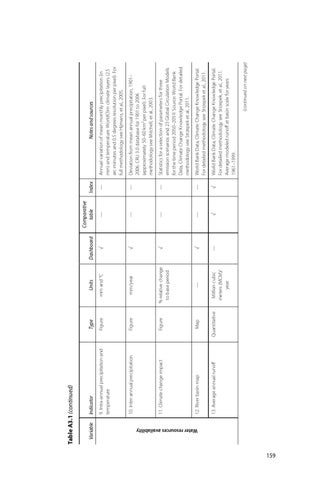
13. Average annual runoff
Quantitative
Map
12. River basin map
Figure
10. Inter-annual precipitation
Figure
Figure
9. Intra-annual precipitation and temperature
11. Climate change impact
Type
Indicator
Table A3.1 (continued)
Water resources availability
Million cubic meters (MCM)/ year
—
% relative change to base period
mm/year
mm and °C
Units
—
√
√
√
√
Dashboard
√
—
—
—
—
Comparative table
√
—
—
—
—
Index
Notes and sources
(continued on next page)
World Bank Data, Climate Change Knowledge Portal. For detailed methodology see Strzepek, et al., 2011. Average modeled runoff at basin scale for years 1961–1999.
World Bank Data, Climate Change Knowledge Portal. For detailed methodology see Strzepek et al., 2011.
Statistics for a selection of parameters for three emission scenarios and 23 Global Circulation Models for the time period 2050–2059. Source: World Bank Data, Climate Change Knowledge Portal. For detailed methodology see Strzepek et al., 2011.
Deviation from mean annual precipitation, 1901– 2006. CRU 3.0 database for 1901 to 2006 (approximately 50–60 km2 per pixel). For full methodology see Mitchell, et al., 2003.
Annual variation of mean monthly precipitation (in mm) and temperature. WorldClim climate layers (2.5 arc-minutes and 0.5 degrees resolution per pixel). For full methodology see Hijmans, et al., 2005.