Variable
Quantitative
Quantitative
Quantitative
Quantitative
Quantitative
Quantitative
Quantitative
Quantitative
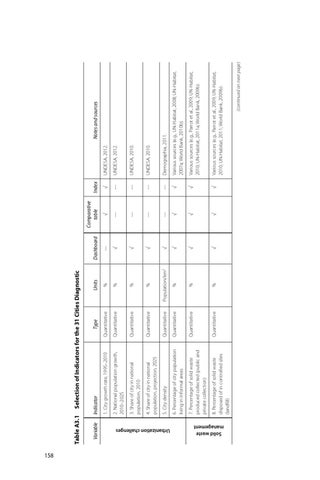
2. National population growth, 2010–2025
3. Share of city in national population, 2010
4. Share of city in national population, projection, 2025
5. City density
6. Percentage of city population living in informal areas
7. Percentage of solid waste produced collected (public and private collection)
8. Percentage of solid waste disposed of in controlled sites (landfill)
Type
1. City growth rate, 1995–2010
Indicator
√
%
%
√
√
√
Population/km2 %
√
√
√
—
Dashboard
%
%
%
%
Units
Table A3.1 Selection of Indicators for the 31 Cities Diagnostic
Urbanization challenges
Solid waste management
158 √
√
√
—
—
—
—
√
Comparative table
√
√
√
—
—
—
—
√
Index UNDESA, 2012.
(continued on next page)
Various sources (e.g., Parrot et al., 2009; UN-Habitat, 2010; UN-Habitat, 2011; World Bank, 2009b).
Various sources (e.g., Parrot et al., 2009; UN-Habitat, 2010; UN-Habitat, 2011a; World Bank, 2009b).
Various sources (e.g., UN-Habitat, 2008; UN-Habitat, 2007a; World Bank, 2010b).
Demographia, 2011.
UNDESA, 2010.
UNDESA, 2010.
UNDESA, 2012.
Notes and sources