154 The Future of Water in African Cities
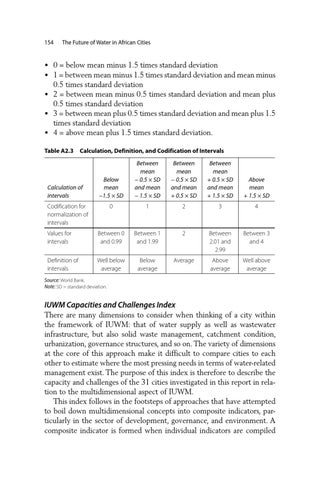
• 0 = below mean minus 1.5 times standard deviation • 1 = between mean minus 1.5 times standard deviation and mean minus 0.5 times standard deviation • 2 = between mean minus 0.5 times standard deviation and mean plus 0.5 times standard deviation • 3 = between mean plus 0.5 times standard deviation and mean plus 1.5 times standard deviation • 4 = above mean plus 1.5 times standard deviation. Table A2.3 Calculation, Definition, and Codification of Intervals
Below mean −1.5 × SD
Between mean − 0.5 × SD and mean − 1.5 × SD
Between mean − 0.5 × SD and mean + 0.5 × SD
Between mean + 0.5 × SD and mean + 1.5 × SD
Above mean + 1.5 × SD
0
1
2
3
4
Values for intervals
Between 0 and 0.99
Between 1 and 1.99
2
Between 2.01 and 2.99
Between 3 and 4
Definition of intervals
Well below average
Below average
Average
Above average
Well above average
Calculation of intervals Codification for normalization of intervals
Source: World Bank. Note: SD = standard deviation.
IUWM Capacities and Challenges Index There are many dimensions to consider when thinking of a city within the framework of IUWM: that of water supply as well as wastewater infrastructure, but also solid waste management, catchment condition, urbanization, governance structures, and so on. The variety of dimensions at the core of this approach make it difficult to compare cities to each other to estimate where the most pressing needs in terms of water-related management exist. The purpose of this index is therefore to describe the capacity and challenges of the 31 cities investigated in this report in relation to the multidimensional aspect of IUWM. This index follows in the footsteps of approaches that have attempted to boil down multidimensional concepts into composite indicators, particularly in the sector of development, governance, and environment. A composite indicator is formed when individual indicators are compiled