In-Depth Analysis of Water Management Challenges in Selected Cities 95
surface-water sources (from the Nabijo, Nabiyonga, and Namatala Rivers), groundwater from a local well (at this stage only for cluster 5 due to lack of information), and greywater recycling for 75 percent of the population. Schematic presentation of the water supply and sanitation in Cluster 5 (as a typical example of the new clusters) is shown in Figure 4.8.5 The steps identified in the road map for implementation of the strategy were: acquire key information, create stakeholder platform, identify project champion, and design and develop demonstrations. The case studies carried out are only an initial step. It is important to recognize that
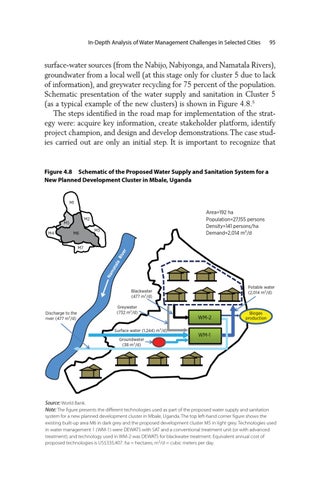
Figure 4.8 Schematic of the Proposed Water Supply and Sanitation System for a New Planned Development Cluster in Mbale, Uganda
M1
M4
Area=192 ha Population=27,155 persons Density=141 persons/ha Demand=2,014 m3/d
M2
M5 M6
M3
M7
Potable water (2,014 m3/d)
Blackwater (477 m3/d)
Discharge to the river (477 m3/d)
Greywater (732 m3/d)
Surface water (1,244) m3/d) Groundwater (38 m3/d)
WM-2
Biogas production
WM-1
Source: World Bank. Note: The figure presents the different technologies used as part of the proposed water supply and sanitation system for a new planned development cluster in Mbale, Uganda. The top left-hand corner figure shows the existing built-up area M6 in dark grey and the proposed development cluster M5 in light grey. Technologies used in water management 1 (WM-1) were DEWATS with SAT and a conventional treatment unit (or with advanced treatment); and technology used in WM-2 was DEWATS for blackwater treatment. Equivalent annual cost of proposed technologies is US$335,407. ha = hectares; m3/d = cubic meters per day.