In-Depth Analysis of Water Management Challenges in Selected Cities 93
to supply 1,000 cubic meters per day, reflecting the increasingly seasonal nature of the flow in these rivers compared to the present. Surface water from the Namatala River, flowing on the outskirts of Mbale, has also been considered as a potential source (with up to 2,000 cubic meters per day capacity). However, even at this level, a strong watershed management program needs to be in place to secure the surface river sources. Limited possibilities for retrofitting in the existing town center led the analysts to suggest isolating this as a cluster and apply only limited greywater recycling. It is suggested that the existing Mbale central business district be ring-fenced so that its central infrastructure system does not extend beyond its cluster boundary. By 2035 it is planned that 8,906 cubic meters per day for the central business district will come from the Manafwa River. The remaining water demand will be supplied by recycled greywater (951 cubic meters per day) from 30 percent of the high- and middle-income communities (which constitute 5 percent and 50 percent of the population, respectively). Hence, effectively, greywater recycling in
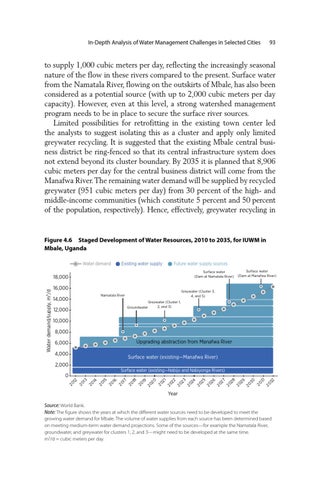
Figure 4.6 Staged Development of Water Resources, 2010 to 2035, for IUWM in Mbale, Uganda Water demand
Existing water supply
Future water supply sources Surface water (Dam at Namatala River)
Water demand/supply, m3/d
18,000 16,000 14,000 12,000
Surface water (Dam at Manafwa River)
Greywater (Cluster 3, 4, and 5)
Namatala River Groundwater
Greywater (Cluster 1, 2, and 3)
10,000 8,000 6,000 4,000 2,000
Surface water (existing—Manafwa River) Surface water (existing—Nabijo and Nabiyonga Rivers)
20 12 20 13 20 14 20 15 20 16 20 17 20 18 20 19 20 20 20 21 20 22 20 23 20 24 20 25 20 26 20 27 20 28 20 29 20 30 20 31 20 32
0
Upgrading abstraction from Manafwa River
Year
Source: World Bank. Note: The figure shows the years at which the different water sources need to be developed to meet the growing water demand for Mbale. The volume of water supplies from each source has been determined based on meeting medium-term water demand projections. Some of the sources—for example the Namatala River, groundwater, and greywater for clusters 1, 2, and 3—might need to be developed at the same time. m3/d = cubic meters per day.