86 The Future of Water in African Cities
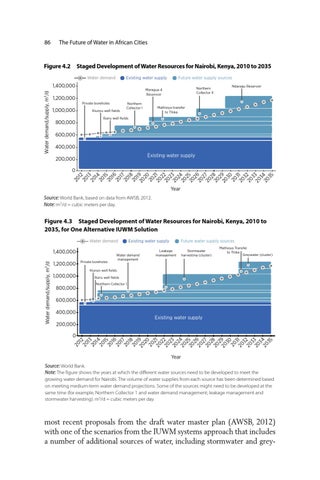
Figure 4.2 Staged Development of Water Resources for Nairobi, Kenya, 2010 to 2035 Water demand
Existing water supply
Water demand/supply, m3/d
1,400,000 1,200,000 1,000,000 800,000
Future water supply sources Northern Collector II
Maragua 4 Reservoir Private boreholes Kiunyu well fields
Northern Collector I
Ndaragu Reservoir
Mathioya transfer to Thika
Ruiru well fields
600,000 400,000 Existing water supply
200,000
20 12 20 13 20 14 20 15 20 16 20 17 20 18 20 1 20 9 20 20 2 20 1 22 20 2 20 3 24 20 2 20 5 26 20 2 20 7 28 20 2 20 9 30 20 3 20 1 32 20 3 20 3 34 20 35
0 Year Source: World Bank, based on data from AWSB, 2012. Note: m3/d = cubic meters per day.
Figure 4.3 Staged Development of Water Resources for Nairobi, Kenya, 2010 to 2035, for One Alternative IUWM Solution Water demand
Water demand/supply, m3/d
1,400,000 1,200,000
Private boreholes
Existing water supply
Water demand management
Future water supply sources
Leakage management
Stormwater harvesting (cluster)
Mathioya Transfer to Thika Greywater (cluster)
Kiunyo well fields
1,000,000 800,000
Ruiru well fields Northern Collector I
600,000 400,000
Existing water supply
200,000 20 12 20 13 20 14 20 15 20 16 20 17 20 18 20 1 20 9 20 20 2 20 1 22 20 2 20 3 24 20 2 20 5 26 20 2 20 7 28 20 2 20 9 30 20 3 20 1 3 20 2 3 20 3 34 20 35
0
Year Source: World Bank. Note: The figure shows the years at which the different water sources need to be developed to meet the growing water demand for Nairobi. The volume of water supplies from each source has been determined based on meeting medium-term water demand projections. Some of the sources might need to be developed at the same time (for example, Northern Collector 1 and water demand management; leakage management and stormwater harvesting). m3/d = cubic meters per day.
most recent proposals from the draft water master plan (AWSB, 2012) with one of the scenarios from the IUWM systems approach that includes a number of additional sources of water, including stormwater and grey-