Table
2.33
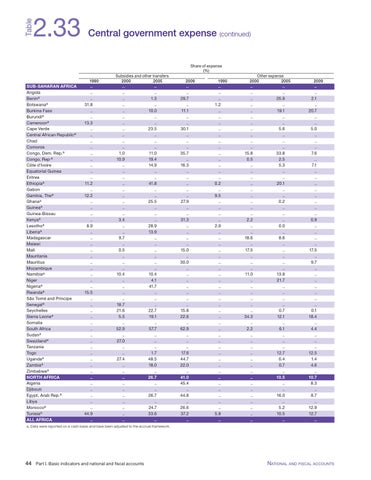
Central government expense (continued)
Share of expense (%) 1990
SUB-SAHARAN AFRICA Angola Benina Botswanaa Burkina Faso Burundia Cameroona Cape Verde Central African Republica Chad Comoros Congo, Dem. Rep.a Congo, Rep.a Côte d'Ivoire Equatorial Guinea Eritrea Ethiopiaa Gabon Gambia, Thea Ghanaa Guineaa Guinea-Bissau Kenyaa Lesothoa Liberiaa Madagascar Malawi Mali Mauritania Mauritius Mozambique Namibiaa Niger Nigeriaa Rwandaa São Tomé and Príncipe Senegala Seychelles Sierra Leonea Somalia South Africa Sudana Swazilanda Tanzania Togo Ugandaa Zambiaa Zimbabwea NORTH AFRICA Algeria Djibouti Egypt, Arab Rep.a Libya Moroccoa Tunisiaa ALL AFRICA
.. .. .. 31.8 .. .. 13.3 .. .. .. .. .. .. .. .. .. 11.2 .. 12.2 .. .. .. .. 8.9 .. .. .. .. .. .. .. .. .. .. 15.5 .. .. .. .. .. .. .. .. .. .. .. .. .. .. .. .. .. .. .. 44.9 ..
Subsidies and other transfers 2000 2005
.. .. .. .. .. .. .. .. .. .. .. 1.0 10.9 .. .. .. .. .. .. .. .. .. 3.4 .. .. 9.7 .. 0.5 .. .. .. 10.4 .. .. .. .. 18.7 21.6 5.5 .. 52.9 .. 27.0 .. .. 27.4 .. .. .. .. .. .. .. .. .. ..
.. .. 1.3 .. 10.0 .. .. 23.5 .. .. .. 11.0 19.4 14.9 .. .. 41.8 .. .. 25.5 .. .. .. 28.9 13.9 .. .. .. .. .. .. 10.4 4.1 41.7 .. .. .. 22.7 19.1 .. 57.7 .. .. .. 1.7 48.5 18.0 .. 26.7 .. .. 26.7 .. 24.7 33.6 ..
2009
.. .. 29.7 .. 11.1 .. .. 30.1 .. .. .. 35.7 .. 16.3 .. .. .. .. .. 27.9 .. .. 31.3 .. .. .. .. 15.0 .. 30.0 .. .. .. .. .. .. .. 15.8 22.6 .. 62.9 .. .. .. 17.6 44.7 22.0 .. 41.0 45.4 .. 44.8 .. 26.6 37.2 ..
1990
.. .. .. 1.2 .. .. .. .. .. .. .. .. .. .. .. .. 0.2 .. 9.5 .. .. .. .. 2.9 .. .. .. .. .. .. .. .. .. .. .. .. .. .. .. .. .. .. .. .. .. .. .. .. .. .. .. .. .. .. 5.8 ..
Other expense 2000 2005
.. .. .. .. .. .. .. .. .. .. .. 15.8 0.5 .. .. .. .. .. .. .. .. .. 2.2 .. .. 18.6 .. 17.5 .. .. .. 11.0 .. .. .. .. .. .. 34.3 .. 2.2 .. .. .. .. .. .. .. .. .. .. .. .. .. .. ..
.. .. 25.9 .. 19.1 .. .. 5.6 .. .. .. 33.8 2.5 5.3 .. .. 20.1 .. .. 0.2 .. .. .. 0.0 .. 8.6 .. .. .. .. .. 13.8 21.7 .. .. .. .. 0.7 12.1 .. 6.1 .. .. .. 12.7 0.4 0.7 .. 10.5 .. .. 16.0 .. 5.2 10.5 ..
2009
.. .. 2.1 .. 20.7 .. .. 5.0 .. .. .. 7.6 .. 7.1 .. .. .. .. .. .. .. .. 0.9 .. .. .. .. 17.5 .. 9.7 .. .. .. .. .. .. .. 0.1 18.4 .. 4.4 .. .. .. 12.5 1.4 4.6 .. 10.7 8.3 .. 8.7 .. 12.9 12.7 ..
a. Data were reported on a cash basis and have been adjusted to the accrual framework.
44
Part I. Basic indicators and national and fiscal accounts
NATIONAL AND FISCAL ACCOUNTS