26
Table 1.4
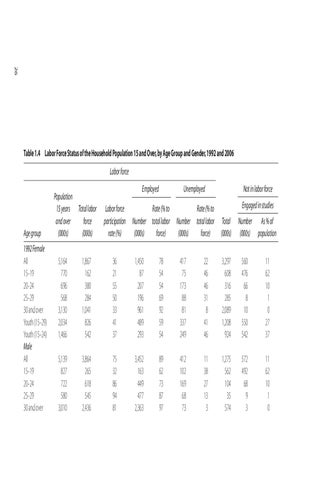
Labor Force Status of the Household Population 15 and Over, by Age Group and Gender, 1992 and 2006 Labor force
Age group 1992 Female All 15–19 20–24 25–29 30 and over Youth (15–29) Youth (15–24) Male All 15–19 20–24 25–29 30 and over
Employed
Unemployed
Not in labor force
Population 15 years and over (000s)
Total labor force (000s)
Labor force participation rate (%)
Number (000s)
Rate (% to total labor force)
Number (000s)
Rate (% to total labor force)
Total (000s)
Number (000s)
As % of population
5,164 770 696 568 3,130 2,034 1,466
1,867 162 380 284 1,041 826 542
36 21 55 50 33 41 37
1,450 87 207 196 961 489 293
78 54 54 69 92 59 54
417 75 173 88 81 337 249
22 46 46 31 8 41 46
3,297 608 316 285 2,089 1,208 924
560 476 66 8 10 550 542
11 62 10 1 0 27 37
5,139 827 722 580 3,010
3,864 265 618 545 2,436
75 32 86 94 81
3,452 163 449 477 2,363
89 62 73 87 97
412 102 169 68 73
11 38 27 13 3
1,275 562 104 35 574
572 492 68 9 3
11 62 10 1 0
Engaged in studies