The Internet Is Changing the Labor Market Arrangements
● 189
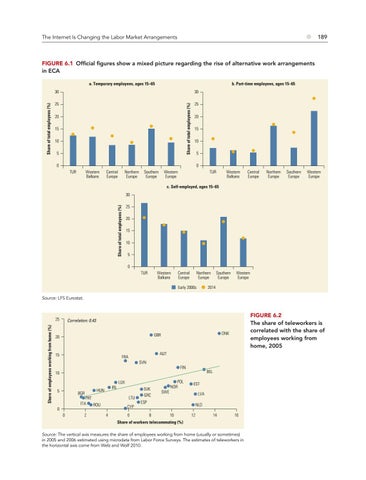
Figure 6.1 Official figures show a mixed picture regarding the rise of alternative work arrangements in ECA b. Part-time employees, ages 15–65 30
25
25
Share of total employees (%)
Share of total employees (%)
a. Temporary employees, ages 15–65 30
20 15 10 5
20 15 10 5
0
0 TUR
Western Balkans
Central Europe
Northern Europe
Southern Europe
Western Europe
TUR
Western Balkans
Central Europe
Northern Europe
Southern Europe
Western Europe
c. Self-employed, ages 15–65
Share of total employees (%)
30 25 20 15 10 5 0 TUR
Western Balkans
Northern Europe
Central Europe
Early 2000s
Southern Europe
Western Europe
2014
Source: LFS Eurostat.
Share of employees working from home (%)
25
Figure 6.2 The share of teleworkers is correlated with the share of employees working from home, 2005
Correlation: 0.43 DNK
GBR
20
15
AUT
FRA SVN
FIN
BEL
10
5
BGR
IRL
HUN
LTU
PRT ITA ROU
0 0
2
LUX
CYP 4
6
SVK GRC
SWE
POL NOR
EST LVA
ESP
NLD 8
10
12
14
16
Share of workers telecommuting (%) Source: The vertical axis measures the share of employees working from home (usually or sometimes) in 2005 and 2006 estimated using microdata from Labor Force Surveys. The estimates of teleworkers in the horizontal axis come from Welz and Wolf 2010.