11 minute read
Pare nt Surve y – Highlights


A majority of parents (67 percent) believe that walking and biking to and from school is healthy (38 percent) or very healthy (29 percent) for their child.
PARENT SURVEY – HIGHLIGHTS
For the complete Parent Survey results see Appendix A.
The Ogema Elementary School serves grades PK-4 with a total school enrollment of 252. Due to many students having siblings that also attend the Ogema School, only 100 surveys were distributed to parents. Of that 100, only 39 parent surveys were returned and met the criteria for inclusion in this report.
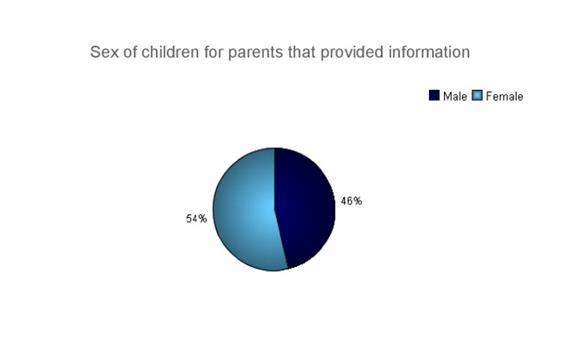
Question – Is the child who brought home this survey male or female? Approximately 54 percent of questionnaires were completed for male and 46 percent for female students.
Figure 20: Breakdown of male/female student representation in the parent survey.
Chapter 8: Standardized SRTS Survey Analysis | P a g e 65
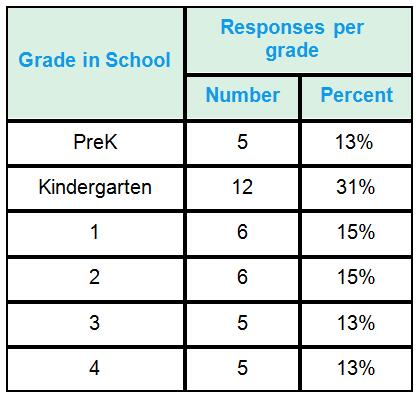
Question – What is the grade of the child who brought home this survey? Kindergarten, followed by 1st and 2nd grade, had the highest number of responses, followed by the other three grades (see Table 7). The percentages listed in the right column are not the percent of survey returns versus the total number of students in each grade. It is simply the percentage of surveys returned from that grade as part of the 39 total that were returned from the entire school. This is also what the term “percent” represents in most of the following survey questions. While a sample of 39 out of a school of 252 students may be enough to interpret parental attitudes from the school as a whole, the small number of returns of just five or six from some grades is likely not enough to draw accurate conclusion of parental attitudes in just those individual grade subsets.
Table 7: Ogema Public School grade levels of children represented in parent survey (Fall 2014).
Grade levels of children represented in survey
P a g e 66 | Chapter 8: Standardized SRTS Survey Analysis
Question – On most days, how does your child arrive and leave for school? A comparison of a child’s typical travel mode of arrival at and departure from school, as reported by parents, is shown in Figure 21 and Table 8. The survey is structured so that parents can give an answer for both how their child arrives at school and then leaves from school. Based on the parent responses, the school bus was the most common mode of travel both to and from school representing 64 percent and 67 percent of all trips, respectively. The second most frequently chosen mode for travel to and from school was the family vehicle at 28 percent and 31 percent, followed by walking at 5 and 3 percent.
The modes of travel chosen for school departure were not notably different than during arrival.
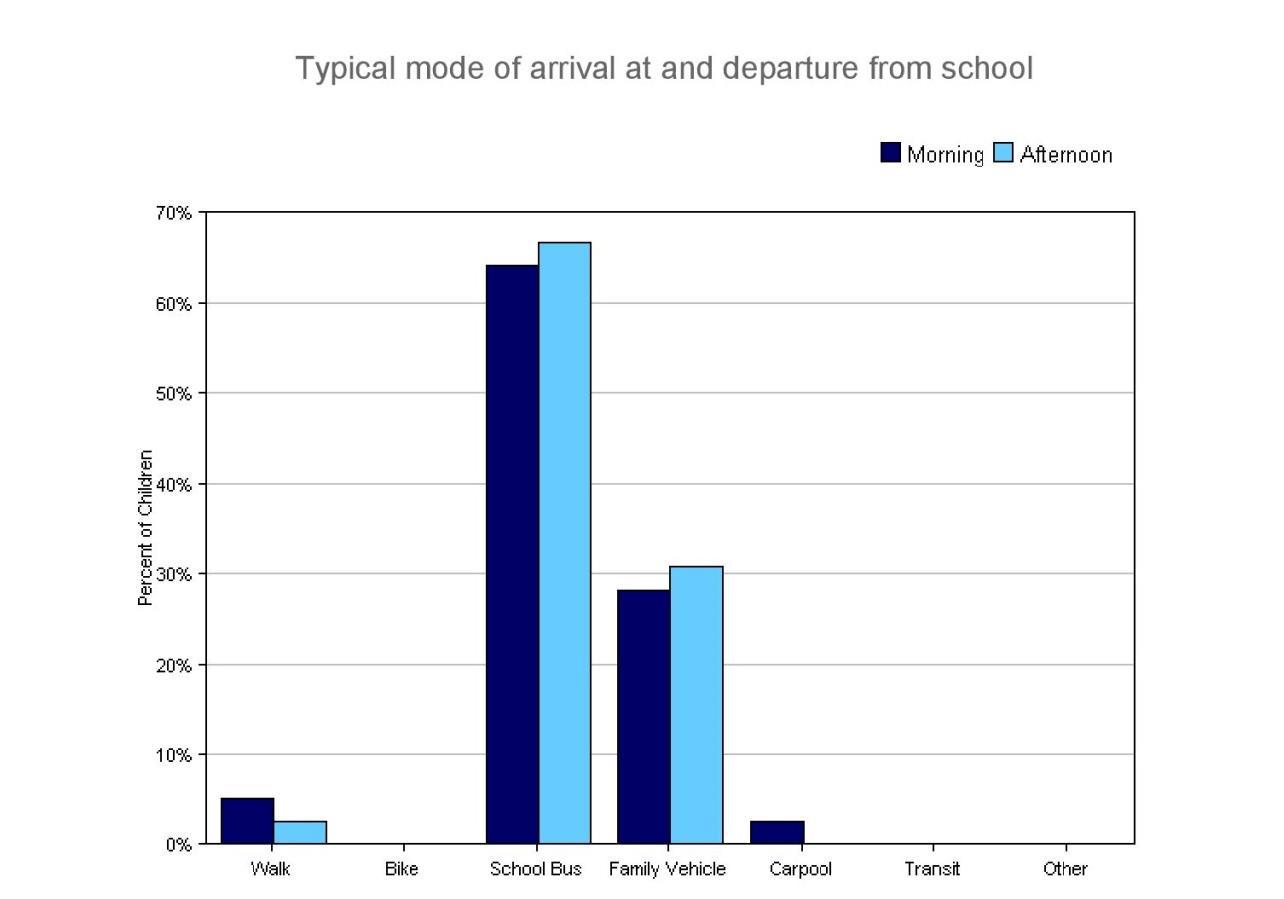
Figure 21: Typical mode of arrival at and departure from school (Fall 2014)
Chapter 8: Standardized SRTS Survey Analysis | P a g e 67
Table 8: Typical mode of arrival at and departure from school (Fall 2014)
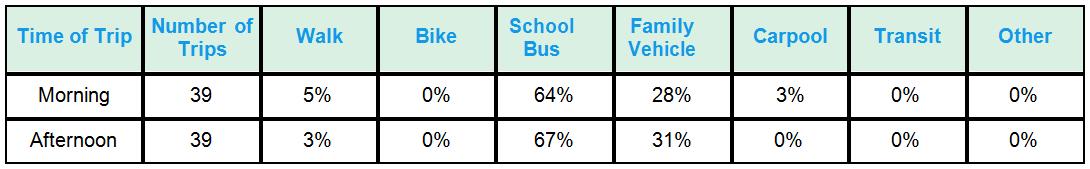
No Response Morning: 0 No Response Afternoon: 0 Percentages may not total 100% due to rounding.
Question – How far does your child live from school?
Parents were asked to give the distance from their home to the school. This question is asked in a way so that parents likely estimate that distance. These results are shown in Table 9. This is recorded because what parents estimate will have an effect on their mode choice for their child. Often parents will overestimate that distance and drive their child to school when walking and/or biking is a viable, safe and timely alternative.
Table 9: Parent estimate of distance from the child’s home to school.
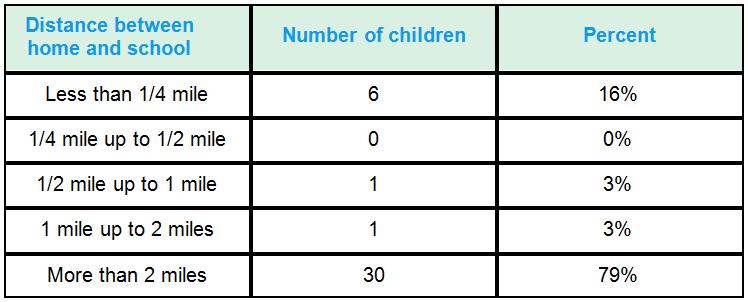
Don't know or No response: 3 Percentages may not total 100% due to rounding.
P a g e 68 | Chapter 8: Standardized SRTS Survey Analysis
Cross-reference – Distance, by arrival and departure modes These estimated distances are then cross-referenced with actual arrival and departure mode choice (Tables 10 and 11).
Table 10: Parent estimate of the distance from child’s home to school and mode choice to school (Fall 2014).
School Arrival
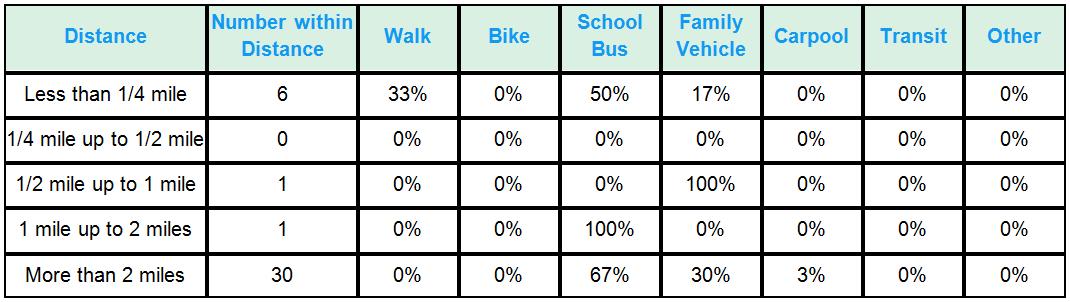
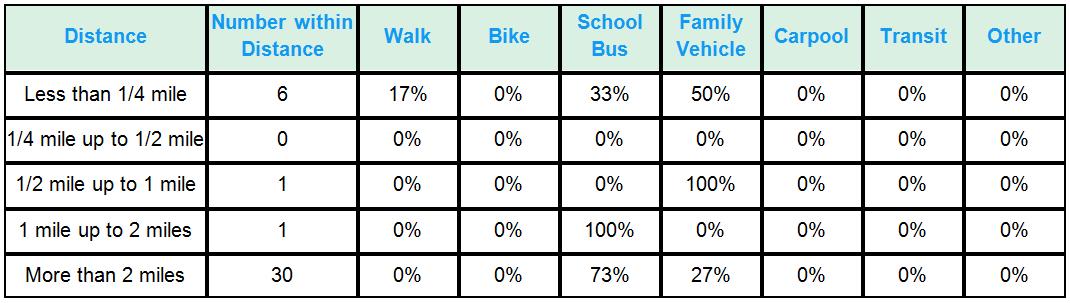
Table 11: Parent estimate of the distance from child’s home to school and mode choice from school (Fall 2014).
School Departure
Chapter 8: Standardized SRTS Survey Analysis | P a g e 69
For the six students reported to live within one-quarter mile of the school, the school bus and the family vehicle still make up a sizable percentage of trips, particularly in the afternoon. No children are reported to live within one-quarter to one-half mile from the school. Only one child is reported to travel the estimated one half to one mile to school and that child is driven in the family vehicle both to and from school. Again, only one child is reported to travel the estimated one to two miles to school and that child uses the school bus to travel to and from school. Over two miles, all students use a motorized travel mode to and from school.
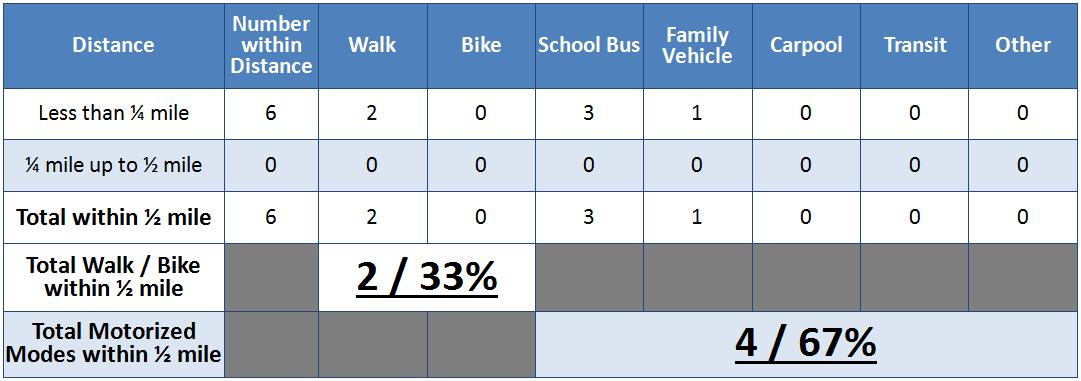
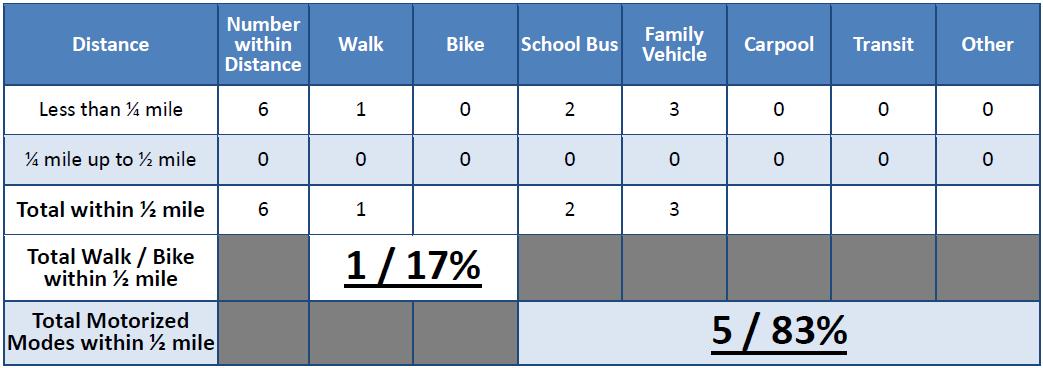
While the sample size was very small (6 students), further WCI staff analysis of the take-home survey data shows that 33 percent of children surveyed who live within one-half mile of the school already walk and bike to school in the morning (Table 12). In the afternoon however, that number decreases to only 17 percent of the children who live within one-half mile of the school, walking or biking home (Table 13). While this subset is extremely small and likely of no statistical significance, it seems to indicate a latent demand by students and/or parents for walking and/or biking up to one-half mile to the Ogema School. This is in keeping with the Walk / Bike Zone concept as defined and promoted by MnDOT which generally assumes a distance of up to a half mile for children in grades PreK-5 are walkable and/or bikeable. For students living within one half mile of the school, parents’ use of the school bus and family vehicle to travel to and from school is likely due to the convenience posed by both modes and of the perceived and/or real dangers posed by automobile traffic on U.S. Highway 59 and on the other roads in Ogema.
Table 12: School arrival modes for PK-4 students (raw numbers and percent) living within ½ mile of the Ogema Elementary School. A half mile is considered the appropriate maximum walking / biking distance for the PK-4 students that attend the Ogema School.
P a g e 70 | Chapter 8: Standardized SRTS Survey Analysis
Table 13: School departure modes for PK-4 students (raw numbers and percent) living within ½ mile of the Ogema Elementary School. A half mile is considered the appropriate maximum walking / biking distance for the PK-4 students that attend the Ogema School.
Question – What of the following issues affected your decision to allow, or not allow, your child to walk or bike to/from school? Parents were asked to identify issues affecting their decision to allow, or not allow, their child to walk or bike to and from school. Parents were given a list of options to choose from, with the ability to select as many reasons they felt applied. The results from this question were then split by whether parents did allow their child to walk or bike to and from school, or did not.
For this question, 30 parents said their “Child does not walk/bike to school,” one parent said their “Child walks/bikes to school,” and 8 parents did not answer.
Figure 22 illustrates the issues affecting parents’ decision to not allow their child to walk or bike both to and from school. For the 30 parents of children who do not walk or bike to/from school, the top four issues affecting their decision are “distance” (87 percent), “ weather or climate” (73 percent), “speed of traffic along route” (70 percent), and “amount of traffic along route” (67 percent). The four least frequently cited issues are a lack of “sidewalks or pathways” (40 percent), “child’s participation in after school programs ” (40 percent), “convenience of driving” (37 percent), and “adults to bike/walk with” (37 percent).
Chapter 8: Standardized SRTS Survey Analysis | P a g e 71
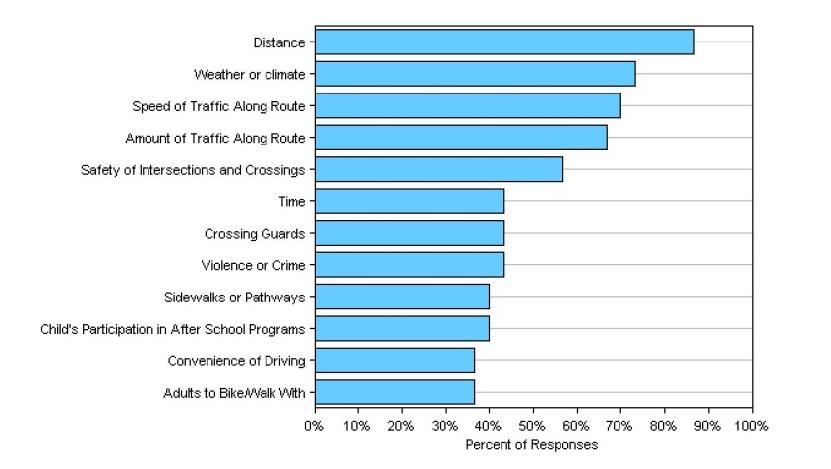
Figure 22: Issues reported to affect the decision to not allow a child to walk or bike to/from school by parents of children who do not walk or bike to/from school (Fall 2014).
P a g e 72 | Chapter 8: Standardized SRTS Survey Analysis
Figure 23 shows the results of the one parent respondent who allows their children to walk or bicycle to/from school. The three issues cited affecting this one parent’s decision were “speed along route” , “amount of traffic along route” , “safety of intersections and crossings” . Despite the phrasing of the question, it would seem that these are more issues of concern for this one parent even though they still allow their child to walk/bike to school.
Note: Because of the low response rate from parents that do allow their children to walk and bike to school (one), the results from this question are likely not statistically significant and likely cannot be compared to the general population or parents that do allow their children to walk and bike to school.
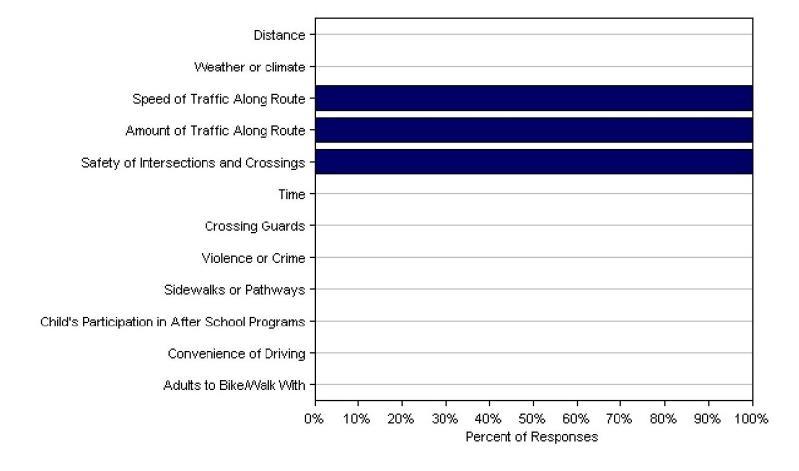
Figure 23: Issues reported to affect the decision to allow a child to walk or bike to/from school by parents of children who already walk or bike to/from school (Fall 2014).
Chapter 8: Standardized SRTS Survey Analysis | P a g e 73
Question – In your opinion, how much does your child’s school encourage or discourage walking and biking to/from school? Figure 24 shows the results of parents’ opinions about how much their child’s school encourages or discourages walking and biking to and from school. A vast majority (71 percent) feel that the Ogema School neither encourages nor discourages walking and biking. However, of the parents that had an opinion, more parents felt that the school discourages the activity to some degree (18 percent combined) versus those parents who believe the school encourages it (12% combined).
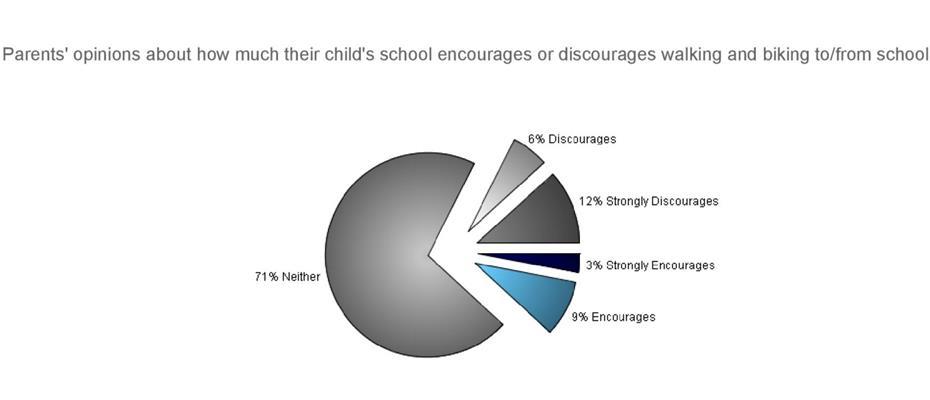
Figure 24: Parents’ opinions about how much their child’s school encourages or discourages walking and biking to/from school.
P a g e 74 | Chapter 8: Standardized SRTS Survey Analysis
Question – In your opinion, how much fun is walking or biking to/from school for your child? Figure 25 shows the results of parents’ opinions about how much fun walking and biking to and from school is for their child. While vast majority (79 percent) have a neutral opinion, and combined 18 percent of parents believe it to be fun to some degree (12 percent fun and, six percent very fun), only 3 percent believe it to be boring or very boring (zero percent believe it to be boring, three percent very boring). Of those that did have an opinion, six times as many thought walking or biking to and from school to be fun or very fun compared to those that thought it to be boring or very boring.
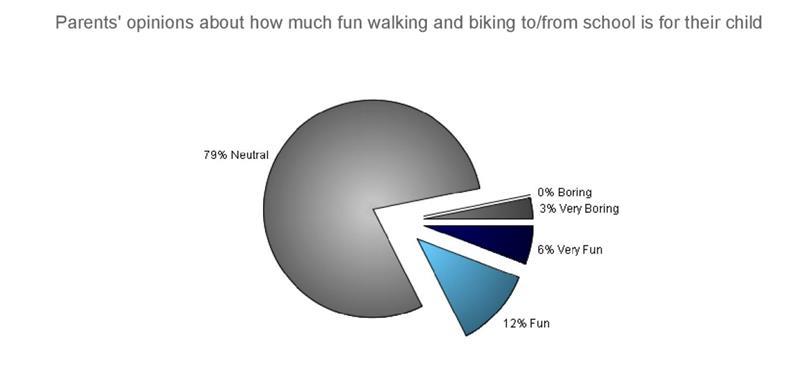
Figure 25: Parents’ opinions about how much fun walking and biking to/from school is for their child.
Chapter 8: Standardized SRTS Survey Analysis | P a g e 75
Question – In your opinion, how healthy is walking or biking to/from school for your child? Figure 26 shows the results of parents’ opinions about how healthy walking and biking to and from school is for their child. A vast majority, 67 percent of parents, believe it to be healthy to some degree for their child (38 percent healthy and 29 percent very healthy). 29 percent had a neutral opinion, three percent believed it to be unhealthy and zero percent believe it to be very unhealthy. Of those parents that had an opinion, 22 times as many parents felt that walking or biking to and from school was healthy for their child.
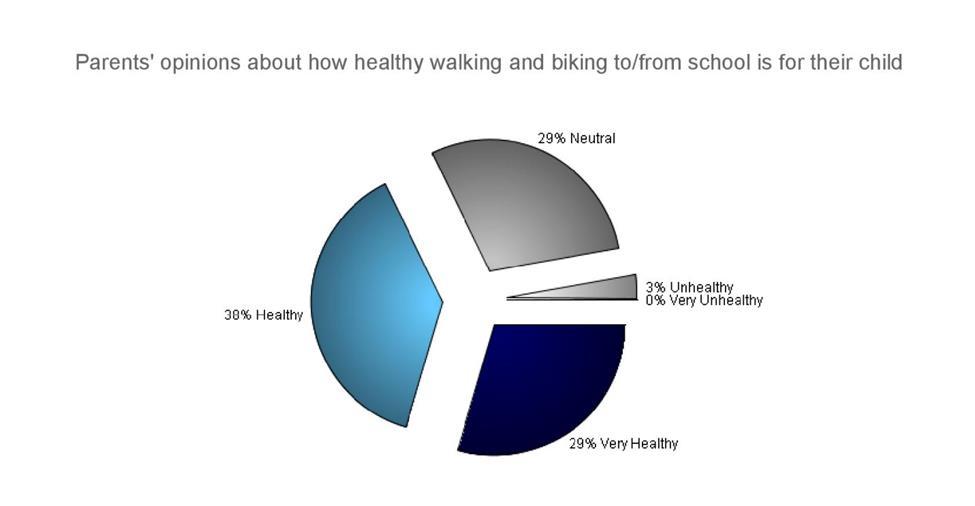
Figure 26: Parents’ opinions about how healthy walking and biking to and from school is for their child.
Parent Comments
Survey ID Comment
1273121 I walk my son across the road (HWY 59) in the morning for school. I would never let him walk alone unless the crosswalk issues is addressed on HWY 59. The traffic does not stop even with signs out and flashers. The speed limit is 40mph in front of the school. We need a school zone. 1273142 Walking and/or bicycling does not effect my household due to the amount of distance 10+ miles.
P a g e 76 | Chapter 8: Standardized SRTS Survey Analysis


