3 minute read
Stude nt Tra vel Tally Hi ghlights


STUDENT TRAVEL TALLY HIGHLIGHTS
(For Complete Student Travel Tally results see Appendix B)
The student travel tally survey is used to quantify students’ travel both to and from school by travel mode. The tally form is administered in school, by teachers. The count is administered school-wide in one single school week. Doing the tally on all three mid-week days (Tuesday, Wednesday and Thursday) is greatly preferred but two of three midweek days is acceptable. Monday and Friday are avoided as possible weekend plans and/or holidays are more likely to affect students’ regular travel behaviors on those two days. Students are asked by a show of hands how they arrived at school that day and then how they plan to leave for home after school. This survey also records weather conditions on each particular day, morning and afternoon separately, as inclement weather can have an obvious effect on children walking or biking to and from school.
The student travel tally counts represent the number of actual recorded student trips (589) to and (569) from school on three days in September, 2014. Differences in these numbers are likely due to teachers forgetting to record a morning and/or afternoon travel tally on one or more days.
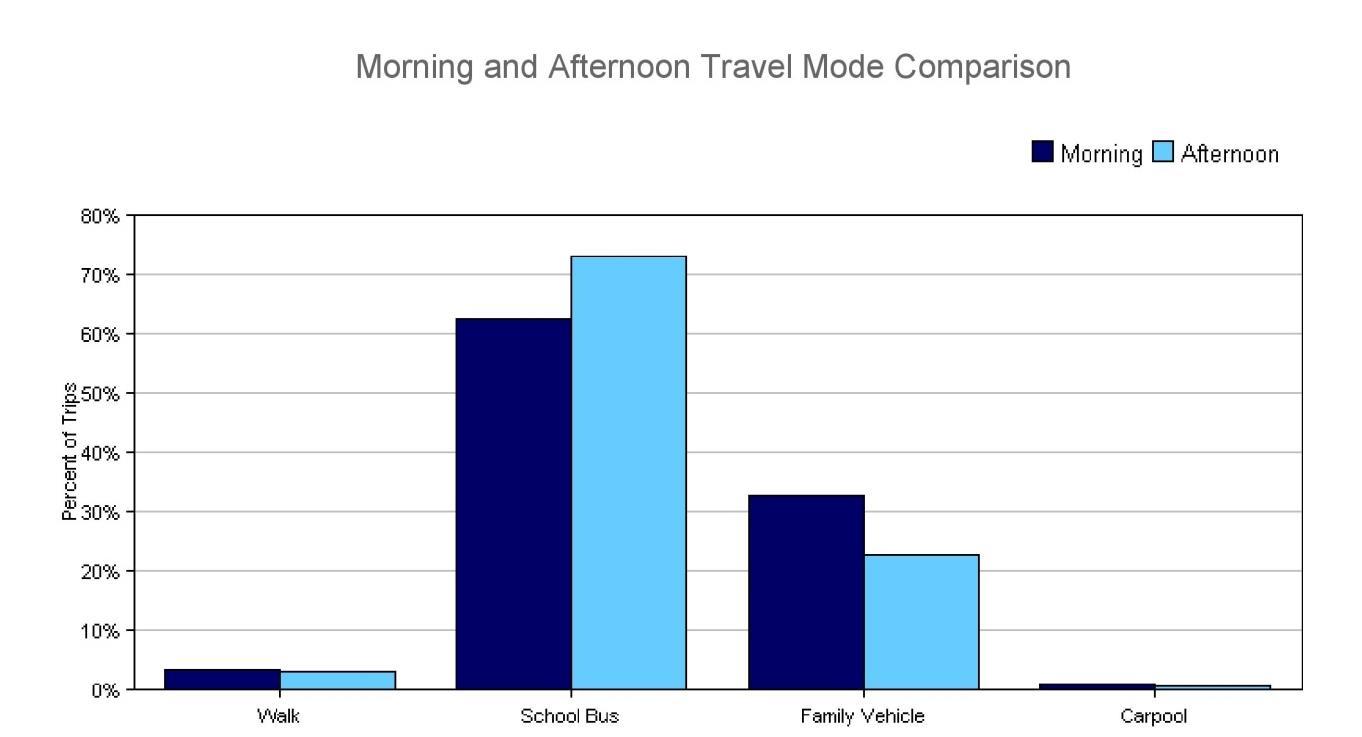
Question – How did you arrive at school today? How do you plan to leave for home after school? Travel mode results from the student travel tally match up well with the travel mode results from the parent survey. As seen in Figure 27 and Table 14, walking rates to school stayed around three percent in both the morning and afternoon. Riding the school bus and traveling in a family vehicle were the two most frequent travel modes. Compared to the morning commute, a lower percentage of students departed from school in a family vehicle and switched instead to the school bus. This is not consistent with the results of the parent survey which showed almost no mode shift in school bus and family vehicle use between morning and afternoon but that had a much smaller sample size. The higher use of a family vehicle in the morning may be due to the convenience of dropping off students while parents are headed to work.
Chapter 8: Standardized SRTS Survey Analysis | P a g e 77
Figure 27: Morning and Afternoon Travel Mode Comparison.
Table 14: Morning and Afternoon Travel Mode Comparison.
Morning and Afternoon Travel Mode Comparison
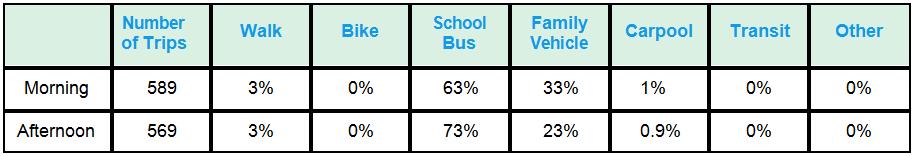
Percentages may not total 100% due to rounding.
Weather Conditions – Sunny, Rainy, Overcast, Snow Arrival and departure modes were then cross-referenced based on weather conditions. The tally sheet allows for the recording of weather conditions each day, both in the morning and afternoon. Results between the two weather conditions (sunny and cloudy) were not noticeably different. As shown in Figure 28 and Table 15, weather did not appear to have an effect on the mode choice of students. Based on the results, a larger percentage of students walked to school in sunny weather conditions compared to overcast conditions. Because the tally was conducted on only three days of one week in September, students’ trips were not counted for all possible weather conditions, including rain and snow. Since a limited number of weather conditions were observed on the dates tallied, conclusions about the influence of weather on the choice of travel modes for students at the Ogema School is limited at best.
P a g e 78 | Chapter 8: Standardized SRTS Survey Analysis
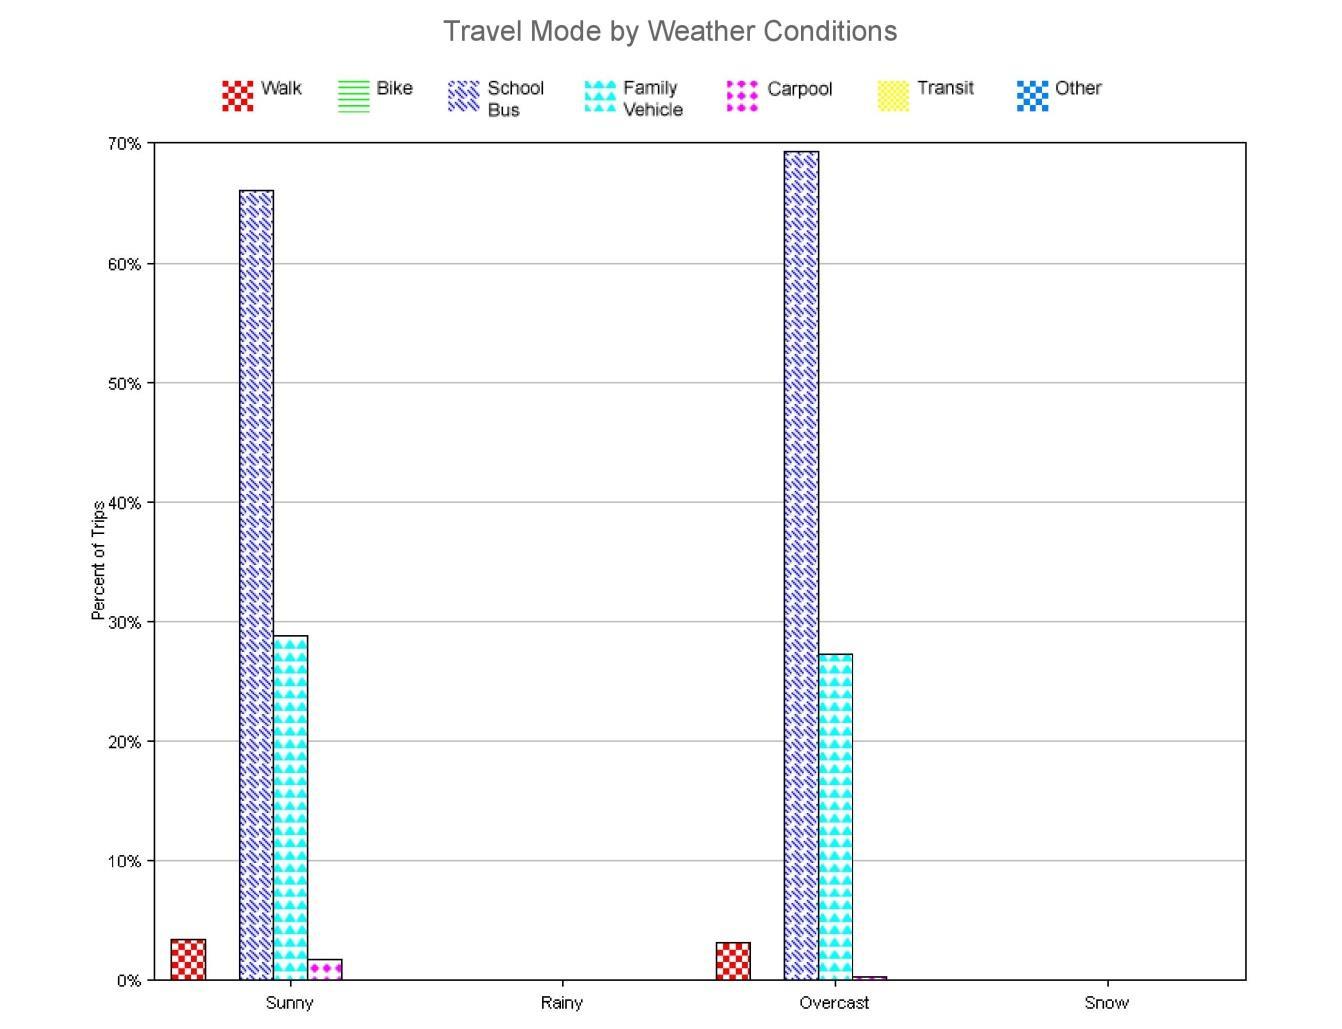
Figure 28: Travel mode by weather conditions (Fall 2014).
Table 15: Travel mode by weather conditions (Fall 2014).
Travel Mode by Weather Condition
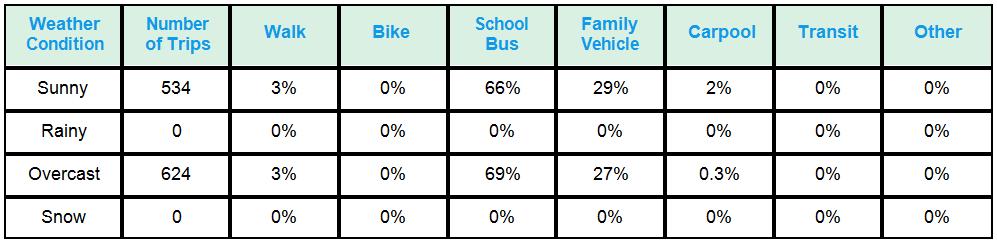
Percentages may not total 100% due to rounding.
Chapter 8: Standardized SRTS Survey Analysis | P a g e 79


