2 minute read
Crash Data


C R A S H D A T A
Crash data with the greatest proximal significance to walking and biking to the Ogema Elementary School was gathered using the online Minnesota Crash Mapping Analysis Tool (MCMAT –http://www.dot.state.mn.us/stateaid/crashmapping.html). The MCMAT data for Ogema was accessed March 30, 2016. As of that date, the dataset included crash reports from January 1, 2005 through June 1, 2015, all of which were included in this analysis. According to the MCMAT homepage, the lag time between crash occurrence and data entry into the MCMAT database can last approximately 2-3 months and the data is updated four times per year (approximately quarterly).
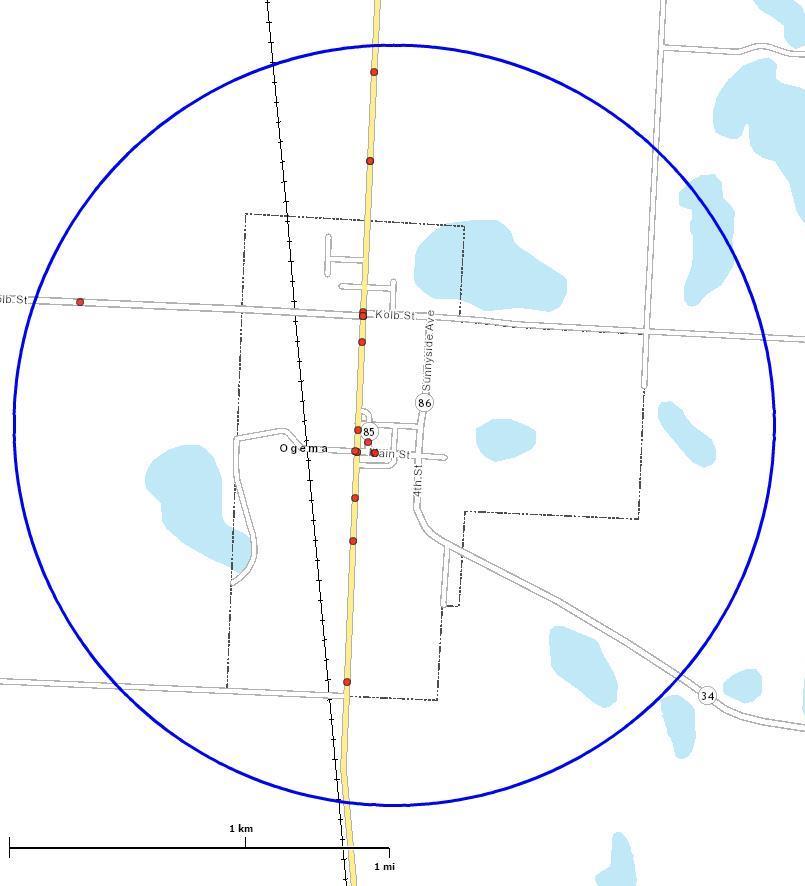
The staff at WCI felt that collecting crash data within a one-mile radius of the intersection of 3rd and Oak Streets would provide the most utility. This intersection is the approximate center of Ogema, around 1650 feet south-southeast of the edge of school property that sits at the northwest edge of city limits. From that center point, a one-mile radius includes all of Ogema’s city limits and all residences that are within the walk / bike zone of the Ogema School plus more for good measure.
A one-mile radius from the above-mentioned center point returns 21 crash reports from the MCMAT dataset. Of the 21, 14 have been mapped (see Figure 17). It is not known why 7 of the crash sites are not shown on the MCMAT generated map. Of these 21 crashes, there were no fatalities, two with nonincapacitating injuries, seven possible injuries, and 12 incidents of property damage (see Figure 18). Of the “Crash Types,” 12 of those crashes involved a collision with another motor vehicle in transport, four involved collisions with a parked motor vehicle, one involved a collision with an “other” non-fixed object, one involved a collision of an “other” type, one involved a collision with a bank, ditch or curb and two involved an overturned vehicle or rollover (see Figure 19). On average, there are 2 crashes in the selected area per year. There was no noticeable correlation with time of day or day of the week, or an increase or decrease in the number of crashes.
No crashes are reported to have involved pedestrians or bicyclists.
A MCMAT-generated crash summary report of all the pertinent crash statistics for the selected area around Ogema can be found on the last page of this chapter.
Chapter 7: Existing Conditions and Findings | P a g e 59
Intersection of 3rd and Oaks Streets
Ogema School Radius Center Point Crash Locations Pedestrian Involved Crash One-mile Radius
Figure 17: Map of the 14 out of 21 crash sites within a one-mile radius of the intersection of 3rd and Oaks Streets. Mapped crash sites are shown as red dots; crashes involving pedestrians if occurring, turquoise blue.
P a g e 60 | Chapter 7: Existing Conditions and Findings
Ogema Crash Severity – Severity Class and Number
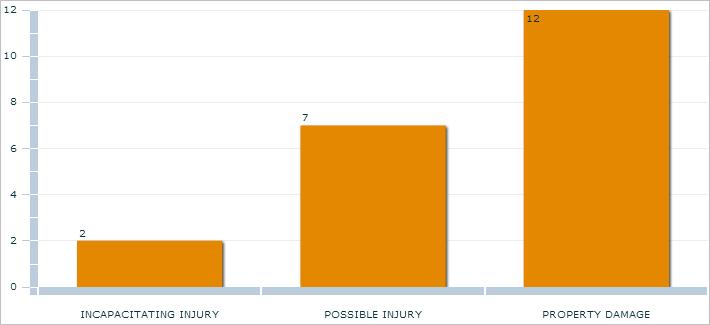
Figure 18: Ogema Crash Severity - Severity Class and Number. Graph automatically generated online by MCMAT.
Ogema Crash Type and Number
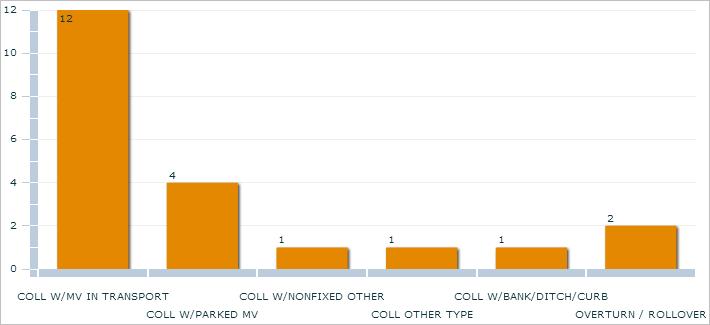
Figure 19: Ogema Crash Type and Number. Graph automatically generated online by MCMAT.
Chapter 7: Existing Conditions and Findings | P a g e 61

P a g e 62 | Chapter 7: Existing Conditions and Findings


