10 minute read
THE FLYOVER PROJECT: Tracking agricultural land-use changes in the Western Cape from 2013 to 2017

by WCDOA pubs

by L Pienaar1
Introduction
Land resources are finite, fragile and nonrenewable, and form the basis for human and other terrestrial ecosystems, as well as agricultural production. The importance of land and its particular usage is fundamental to any country’s development trajectory towards sustainable growth (Kareem, 2018). Its use depends on a wide range of localised factors and detecting such changes is extremely important for development planning and sound decision-making, since it has far-reaching consequences for farmers’ welfare, as well as the environment. Agricultural development in the Western Cape has been earmarked to drive the main objective of creating jobs and economic growth by means of increased productivity and expansions in high-value fruit exports (NPC, 2011; WCDoA, 2015). Additionally, the Western Cape Department of Agriculture (WCDoA) also seeks to achieve Provincial Strategic Goal 4, which is to enable a resilient, sustainable, quality and inclusive living environment (WCG, 2015). In order to achieve such goals in the agricultural sector it is important to have insight into land-use changes and trends over time. However, since information on agricultural output is both limited and outdated, the need for information at a sufficient level of geographic disaggregation was the reason the department embarked on the so-called “Flyover Project”, an aerial census of all agricultural fields in the Western Cape.
The aim of this paper is to briefly explain the process of collecting the flyover information and the value added to the agricultural sector. This will be followed by providing the aggregate changes in land-use across the Western Cape at industry-level. These changes will be explained within the current economic context and will, therefore, provide important insights into what is driving farmlevel decisions and will be concluded with some final thoughts.
Literature Review
Any understanding of land-use change should set out from the premise that virtually all resource allocations take place on land, and land in itself is a scarce resource (Hubacek & Vazquez, 2002). Agricultural land-use decisions are influenced by a host of economic, social, political and bio-physical factors, as well as the multi-functional nature of the agricultural sector. Indeed, since South African farmers compete in globalised and relatively open markets, land-use also depends on spatial location, scale, associated cost, technology, distance to markets and existing land uses among others. There is also ample evidence that the demand for land has been increasing over time and is set to continue in the midst of increasing competition for land (Kareem, 2018). The scarcity created by the competition for land in various sectors such as agriculture, mining, urban and residential expansion, requires the optimal use of land. As incomes grow along with population growth and urbanisation around the world, opportunities exist to invest in land to supply agricultural produce to consumers both locally and internationally. Recent land-use changes are also reflective of managing and protecting land resources as producers are seeking to mitigate the impacts of climate change and the degradation of soils (Wang et al., 2017). At farm level, farmers make dynamic decisions on their crop and/or livestock mix for their respective farming systems. This takes place within the context of mitigating risks inherent in the agricultural sector (weather, water supply, prices and exchange rate volatility, policy impacts etc.) in order to compete in the market. Ultimately, agricultural land-use decisions and competitiveness are based on prices and production volumes per unit. Since the Western Cape has a unique winterrainfall climate (Vink & Tregurtha, 2001), it is able to produce more than 70 different crop types and is also home to a decent livestock population. Most of the fruit and wine grape enterprises require a long-term decision-making framework supported by access to lucrative markets at favourable tariff lines. This is to enhance and maintain a high degree of competitive performance with regard to trading in the global marketplace. Innovation is paramount to supply quality produce consistently, of which constant market innovation plays a pivotal role.
Overview Of The Flyover
One of the key challenges in understanding land-use changes in South Africa (as well as in the provinces) emanates from the lack of updated statistics on agricultural production. Indeed, the last time Statistics South Africa (StatsSA) conducted a census of the agricultural sector was back in 2007 (StatsSA, 2007). Not only is there a need for updating this census, but the survey methodology is also compromised by missing information and details on smaller/alternative crops. To this end, the WCDoA embarked on an extensive project in 2013 to map all agricultural fields in the entire province using an aerial survey captured by using low-flying aeroplanes. This mapping exercise was conducted to provide a baseline of agricultural production activities and to locate all infrastructure related to agriculture. The project is also unique in the sense that it includes the type of irrigation systems utilised on irrigated areas as well as production under tunnels and shade nets. The flyover census for the 2013/14 and 2017/18 seasons captured agricultural land-use both for the summer and winter periods. As a result of the nature of annual crops such as vegetables, additional information on annual area planted was collected by means of telephone interviews with farmers. All the information is compiled into databases hosted within the department and are in the process of being utilised beyond the findings of this analysis.
A final note on the overview of the Flyover Project relates to the timing of the 2017/18 survey period – one of the worst drought seasons ever recorded in the Western Cape. This provided a challenge to analyse trends of annual crops since it was heavily impacted by the drought; yet analysts could also understand the drought impact on land-use, especially vegetable production. The following section will provide the results from the survey within the current economic context.
Results From The Flyover Project
Fruit and wine grapes
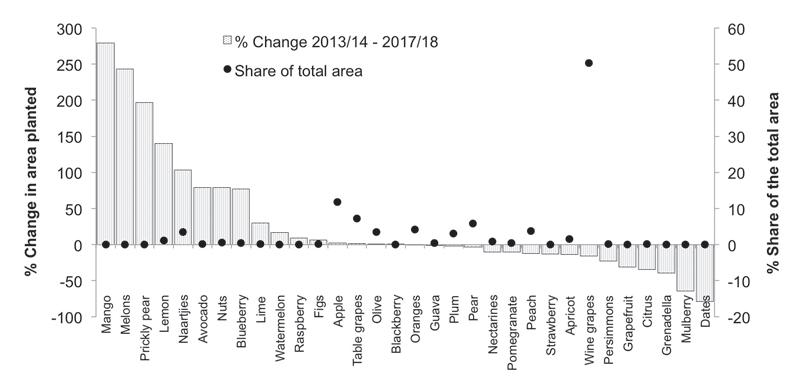
Starting broadly with the fruit and wine grape industries in the Western Cape, Figure 1 gives both the percentage change from 2013/14 to 2017/18, as well as the relative size of each crop type to the total. One can clearly see that the most significant horticultural expansion took place in crops that make up a small percentage of the total area. The industry with the biggest expansion throughout this period was that of citrus, with lemons (1 161 ha) and naartjies (3 168 ha) showing significant increases. These citrus expansions were mainly located in the Cederberg and
Langeberg municipal areas, whilst prickly pears are mostly produced in the Beaufort West and Hessequa municipalities.
The berry industry also showed remarkable growth with especially blueberries growing from 464 ha in 2013/14 to 823 ha in 2017/18; an annual average increase of 12% in area planted. This industry is extremely capital-intensive, reaching around R1 million in establishment costs per hectare when produced under netting structure, but these also realise significantly higher prices per unit.
Some of the bigger and more traditional industries such as pome and stone fruit had relatively stable growth rates over the period under review, with wine grapes being the notable exception. The total area under vineyards used for winemaking has declined by around 16 000 hectares and there is no municipal area where any expansions have been recorded. The land-use changes listed above can generally be explained by the medium-term price realisation for the different fruit types and farmers choosing crops with higher returns per hectare.
Vegetables
The results for the area planted under vegetables were clearly impacted by the drought, with producers generally prioritising orchards at the expense of annual crops. Table 1 provides the breakdown of these changes showing a 27% decline in land used for vegetable production. The most notable declines were that of the two major vegetable crops, potatoes and onions, with a combined decline of 4 630 hectares. These declines were mainly concentrated in the main vegetablegrowing regions such as the Sandveld, Olifants River and Ceres.
Grains and oilseeds
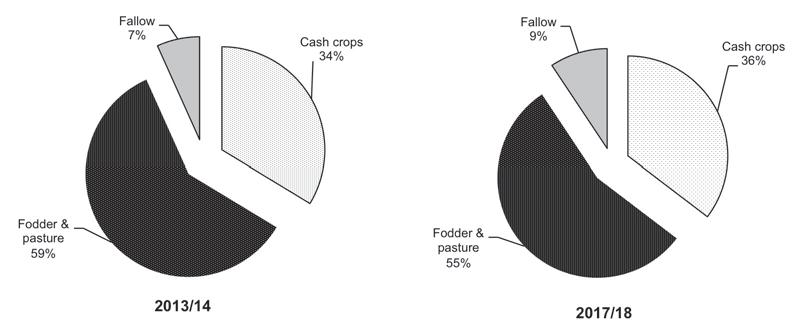
The Western Cape is particularly known for its winter grain production of wheat in both the Swartland and Southern Cape regions. Figure 2 gives the crop mix for each year, as farmers decide on the allocation between fodder, cash crops and fallow land. The planting of cash crops (annual) increased from 511 000 hectares in 2013/14 to around 538 000 hectares in 2017/18, pushing the relative share up by 1,7%. The substantial increase in fallow land, as well as a decline in land used for fodder and pasture, is mainly attributed to drought.
Some of the changes in oilseed area planted can also be explained by profitability considerations, with canola being such an example. Canola area planted has increased from 71 864 hectares in 2013/14 to 90 522 hectares in 2017/18. These increases have coincided with additional crushing capacity in South Africa since 2012. This has led to better price realisation for producers over the past few years with more farmers choosing to use it as part of their rotation systems (BFAP, 2018). However, looking ahead, growers will need to make efficiency gains to push yields higher in order to compete with comparable international growers who
Source: WCDoA, 2018
Source: WCDoA, 2018 are able to produce at around 3 tonnes per hectare. The average across the winter grain area of South Africa is currently 1,1 tonne per hectare (Crop Estimates Committee, 2018).
Livestock
The flyover did not only include the information of the area planted under crops but also included livestock production by means of capturing any field that had livestock grazing on it. As expected, the drought has also significantly impacted the 2017/18 findings in this regard as many farmers were forced to give fodder to animals instead of the normal practice of grazing in the fields. Various farmers have also been forced to reduce their herd size in an attempt to mitigate financial losses. Further analyses of the livestock information from the flyover are still in progress.
On-farm investments
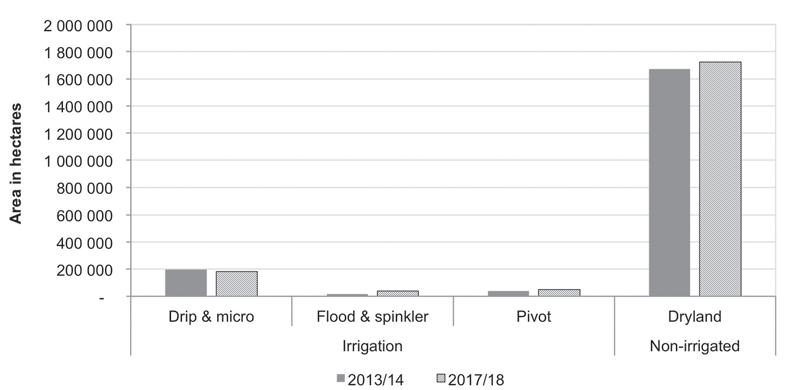
The results from the Flyover Project that relate to the types of irrigation systems utilised for all irrigated fields are given in Figure 3. In total, the area under irrigation has increased by 22 067 hectares in the past four years, whilst expansion in dry-land production is also noted. The increases in the former occurred mainly in the form of pivot and flood irrigation for lucerne in the Kannaland and Oudtshoorn municipalities. The decline in hectares for crops under drip and micro irrigation can be attributed to a significant decline in wine grape area planted rather than be interpreted as a decline in the use of these more efficient systems. The loss of hectares under vineyards had not been completely offset by the expansions in other fruit types due to their relatively higher water requirement per hectare. Therefore, for every hectare of wine grapes pulled out, only a smaller share was replaced with other irrigated crops such as table grapes, citrus, stone and pome fruit as a result of the higher per unit usage of these more profitable crops.
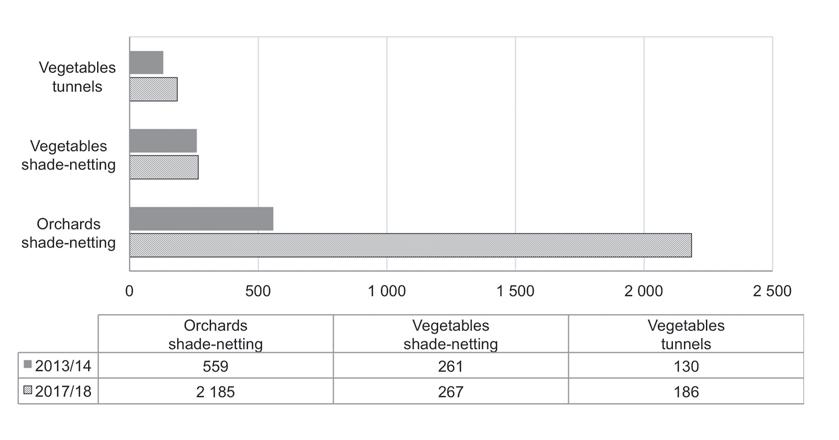
Looking at the growth of crops under shade nets and vegetables produced in tunnels, Figure 4 shows the significant changes since 2013/14. Most notable is the increase of 290% of orchards under nets, whilst the area of vegetables in tunnels increased by 43%. These developments are clearly a result of the continued drive of producers seeking to manage climate-related risks such as drought, wind, sunburn and hail. The increase in shade net and tunnel area is encouraging in the sense that it shows farmers are still willing to invest directly into their farming systems in the quest for improved productivity going forward.
Conclusion
The results from the latest flyover initiative provided important insights into the changes in the use of agricultural land. Although the total area under orchards has declined marginally, there has been a clear shift into higher-value and alternative crops (e.g. blueberries, nuts) and crops with higher water demand per hectare (e.g. soft citrus vs wine grapes). This expansion in irrigated crops came mainly at the expense of wine grape farming, which has declined by 15% over the review period. There has also been a sharp increase in the use of shade nets and tunnel structures resulting in the more efficient use of water across various parts of the Western Cape.
The land usage for vegetable production has declined by around 27% on average from the baseline set in 2013/14 and should be interpreted in the context of drought conditions in many of the main vegetable- growing regions such as the Sandveld, Olifants River and Ceres. Overall, cash crops (wheat, barley, canola etc.) cover 34% of the field crop area and this portion has increased marginally since 2013, with the portion of fodder crops declining marginally from 59% to 55%. Finally, the total area of fallow land increased markedly by around 40 000 hectares.
The results and in particular the baseline of information gathered from analysing two rounds of the Flyover Project over the fouryear period give valuable insights to decision makers and planners, as well as farmers on the development of the sector. This report has set out to track and explain aggregate agricultural land-use changes in the Western Cape within the current economic climate. The Flyover Project will continue to assist the sector at large to align its activities to support jobs and growth in the future.
AP
References
BFAP, 2018. BFAP Baseline: Agricultural Outlook 2018-2027. Pretoria: Bureau for Food and Agricultural Policy.
Crop Estimates Committee, 2018. Winter Cereal (2017): Final Production Estimate. Pretoria: South African Grain Information Service Department of Agriculture, Forestry and Fisheries.
Hubacek, K. & Vazquez, 2002. The economics of land use change. Interim Report: IR02-015. Laxenburg: International Institute for Applied Systems Analysis.
Kareem, O., 2018. The determinants of large-scale land investments in Africa. Land Use Policy, 75, pp.180-90.
NPC, 2011. National Development Plan: Vision for 2030. Pretoria: National Planning Commission.
StatsSA, 2007. Census of Commercial Agriculture: Financial and production statistics. Pretoria: Statistics South Africa.
Vink, N. & Tregurtha, N., 2001. Agriculture and Mariculture: Structure, performance and future prospects Elsenburg: Western Cape Department of Agriculture.
Wang, T. et al., 2017. Determinants of Motives for Land Use Decisions at the Margins of the Corn Belt. Ecological Economics, 134, pp. 227-37.
WCDoA, 2015. Strategic Plan for the fiscal years 2015/16 - 2020/21. Elsenburg: Western Cape Department of Agriculture.
WCDoA, 2018. The Western Cape mapping of agricultural commodities and infrastructure 2013 and 2017 Elsenburg: GIS Services Western Cape Department of Agriculture.
WCG, 2015. Strategic Plan 2015/2016 - 2020/2021. Elsenburg: Western Cape Department of Agriculture.