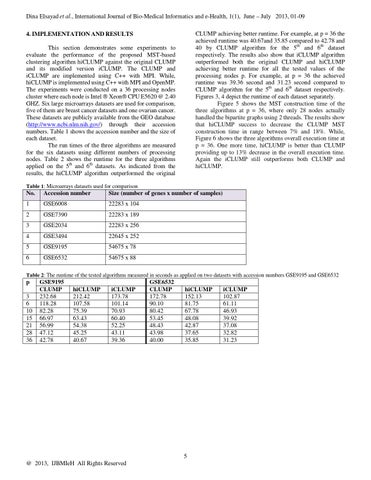
Dina Elsayad et al., International Journal of Bio-Medical Informatics and e-Health, 1(1), June – July 2013, 01-09 CLUMP achieving better runtime. For example, at p = 36 the achieved runtime was 40.67and 35.85 compared to 42.78 and 40 by CLUMP algorithm for the 5th and 6th dataset respectively. The results also show that iCLUMP algorithm outperformed both the original CLUMP and hiCLUMP achieving better runtime for all the tested values of the processing nodes p. For example, at p = 36 the achieved runtime was 39.36 second and 31.23 second compared to CLUMP algorithm for the 5th and 6th dataset respectively. Figures 3, 4 depict the runtime of each dataset separately. Figure 5 shows the MST construction time of the three algorithms at p = 36, where only 28 nodes actually handled the bipartite graphs using 2 threads. The results show that hiCLUMP success to decrease the CLUMP MST construction time in range between 7% and 18%. While, Figure 6 shows the three algorithms overall execution time at p = 36. One more time, hiCLUMP is better than CLUMP providing up to 13% decrease in the overall execution time. Again the iCLUMP still outperforms both CLUMP and hiCLUMP.
4. IMPLEMENTATION AND RESULTS This section demonstrates some experiments to evaluate the performance of the proposed MST-based clustering algorithm hiCLUMP against the original CLUMP and its modified version iCLUMP. The CLUMP and iCLUMP are implemented using C++ with MPI. While, hiCLUMP is implemented using C++ with MPI and OpenMP. The experiments were conducted on a 36 processing nodes cluster where each node is Intel ® Xeon® CPU E5620 @ 2.40 GHZ. Six large microarrays datasets are used for comparison, five of them are breast cancer datasets and one ovarian cancer. These datasets are publicly available from the GEO database (http://www.ncbi.nlm.nih.gov/) through their accession numbers. Table 1 shows the accession number and the size of each dataset. The run times of the three algorithms are measured for the six datasets using different numbers of processing nodes. Table 2 shows the runtime for the three algorithms applied on the 5th and 6th datasets. As indicated from the results, the hiCLUMP algorithm outperformed the original Table 1: Microarrays datasets used for comparison
No.
Accession number
Size (number of genes x number of samples)
1
GSE6008
22283 x 104
2
GSE7390
22283 x 189
3
GSE2034
22283 x 256
4
GSE3494
22645 x 252
5
GSE9195
54675 x 78
6
GSE6532
54675 x 88
Table 2: The runtime of the tested algorithms measured in seconds as applied on two datasets with accession numbers GSE9195 and GSE6532
p 3 6 10 15 21 28 36
GSE9195 CLUMP 232.68 118.28 82.28 66.97 56.99 47.12 42.78
hiCLUMP 212.42 107.58 75.39 63.43 54.38 45.25 40.67
iCLUMP 173.78 101.14 70.93 60.40 52.25 43.11 39.36
GSE6532 CLUMP 172.78 90.10 80.42 53.45 48.43 43.98 40.00
hiCLUMP 152.13 81.75 67.78 48.08 42.87 37.65 35.85
5 @ 2013, IJBMIeH All Rights Reserved
iCLUMP 102.87 61.11 46.93 39.92 37.08 32.82 31.23
