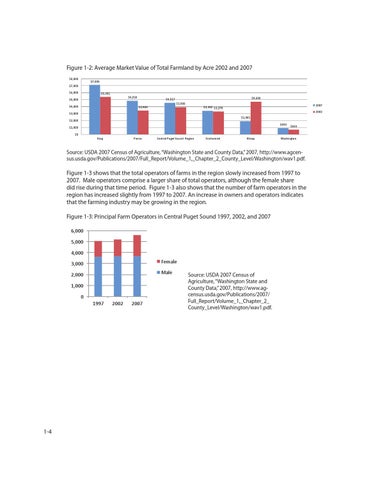
Figure 1-2: Average Market Value of Total Farmland AcreC2002 andby 2007 Average Market Value oby f Total ropland Acre $8,000
$7,085
$7,000 $6,000
$5,381 $4,816
$5,000 $4,000
$3,405
$4,688
$4,517 $3,900
2007
$3,392 $3,270
2002
$3,000 $1,901
$2,000
$893 $663
$1,000 $0 King
Pierce
Central Puget Sound Region
Snohomish
Kitsap
Washington
Source: USDA 2007 Census of Agriculture, “Washington State and County Data,” 2007, http://www.agcensus.usda.gov/Publications/2007/Full_Report/Volume_1,_Chapter_2_County_Level/Washington/wav1.pdf.
Figure 1-3 shows that the total operators of farms in the region slowly increased from 1997 to 2007. Male operators comprise a larger share of total operators, although the female share did rise during that time period. Figure 1-3 also shows that the number of farm operators in the region has increased slightly from 1997 to 2007. An increase in owners and operators indicates that the farming industry may be growing in the region.
Principal Farm Operators in
Figure 1-3: Central Principal Farm Operators Puget Sound in Central Puget Sound 1997, 2002, and 2007 6,000 5,000 4,000 3,000
Female
2,000
Male
1,000 0 1997
1-4
2002
2007
Source: USDA 2007 Census of Agriculture, “Washington State and County Data,” 2007, http://www.agcensus.usda.gov/Publications/2007/ Full_Report/Volume_1,_Chapter_2_ County_Level/Washington/wav1.pdf.