GREATER VICTORIA’S 2023 ANNUAL CHECK-UP


GREATER VICTORIA’S 2023 ANNUAL CHECK-UP

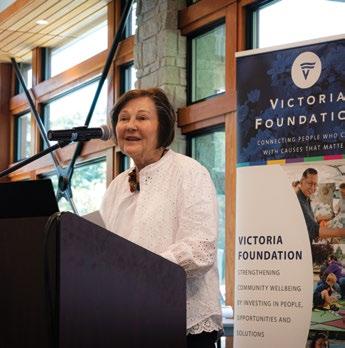
The Victoria Foundation is pleased to present the 18th edition of Vital Signs, Greater Victoria’s annual community check-up. For two decades this report has provided data-driven insight that helps us identify and respond to the most important issues facing residents of Greater Victoria. As we continue to work toward solutions that improve our collective well-being and the vitality of our community, we are reminded that one of the most powerful assets we have is hope. But hope alone is not enough. While hope is what fuels us, it’s the change on the other side of hope that matters most, and it’s where we want to direct our focus. So how do we move from hope to change? We may not have all the answers, but working together, listening, collaborating with our partners, and paying attention to what the data tells us is where we can start. Thank you for reading the 2023 Vital Signs report and being part of the change.


Coast Capital is honoured to partner with the Victoria Foundation as the presenting sponsor of Victoria’s Vital Signs. Each year the report provides the foundational building blocks as we work to understand our community’s most complex and systemic challenges. As a federal financial cooperative and a Certified B Corporation™, Coast Capital has defined our social purpose, Building Better Futures
Together, as our north star vision. It informs the decisions we make and is at the heart of every member, employee, and community partner interaction. At Coast, we believe that one of the most important steps we can take to contribute to an equitable society where everyone can thrive, is to provide opportunities for understanding, dialogue and collaborative action. The Vital Signs report helps us identify those areas where we can lean into purpose-driven partnerships and create more networked solutions. Thank you to everyone at the Victoria Foundation for your dedication to this report and for creating the space for those collaborations to spark.
Businesses in our community are a vital and enriching thread in the economic, social, and cultural fabric of our community.
We would like to express our gratitude to the many businesses that have embraced the opportunity to help create a vibrant, caring community for all, specifically the sponsors whose generosity makes production and promotion of this report possible.
Our thanks also go to all the individuals and organizations that helped to create this report, including those that provided data, took our survey, or helped guide and support the project, including our board and staff at the Victoria Foundation.

 SANDRA RICHARDSON Chief Executive Officer, Victoria Foundation PRESENTING SPONSOR
DIGITAL
SANDRA RICHARDSON Chief Executive Officer, Victoria Foundation PRESENTING SPONSOR
DIGITAL
Established in 1936, the Victoria Foundation is Canada’s second oldest community foundation and sixth largest of over 200 nation-wide. We manage charitable gifts from donors whose generosity allows us to create permanent, income-earning funds. The proceeds from these funds are then distributed as grants for charitable or educational purposes. To date, the Victoria Foundation has invested more than $313 million in people, projects, and non-profit organizations that strengthen communities in BC and throughout Canada.
Victoria’s Vital Signs is an annual community check-up that measures the vitality of our region, identifies concerns, and supports action on issues that are critical to our quality of life. The Victoria Foundation produces the report to connect philanthropy to community needs and opportunities. This is the 18th consecutive year the report has been published. Special thanks to the Toronto Foundation and Community Foundations of Canada for supporting the national Vital Signs initiative. For more information, visit communityfoundations.ca/vitalsigns
The capital region is home to a rich diversity of Indigenous peoples and cultures. Based on the 2021 Census, there were an estimated 19,460 individuals in the Victoria CMA who identified as First Nations, Métis and/or Inuk (Inuit). We acknowledge with respect the Lekwungen speaking people of the Songhees and Esquimalt Nations on whose traditional lands our offices are located.
The following community experts have kindly joined us to help guide Vital Signs and its engagement throughout the region. We thank them for their generosity and support. Andrea Carey, Inclusion Incorporated; Bhupinder Dulku, Victoria Foundation Gadsden Initiative; Diana Gibson, Community Social Planning Council; Chris Gilpin, CRD Arts and Culture Support Service; Dallas Gislason, South Island Prosperity Partnership; Fran Hunt-Jinnouchi/Julia O’Quinn, Aboriginal Coalition to End Homelessness; Del Manak, Victoria Police Department; Jodi Mucha, BC Healthy Communities; Sarah Phillips, BC Transit; Keith Wells, Greater Victoria Sport Tourism Commission; and Bruce Williams, Greater Victoria Chamber of Commerce.
The Victoria Foundation: Melody Burns, Jaime Clifton-Ross, Roxann Corpuz, Jonathon Dyck, Lori Elder, Carol Hall, Taryn Malcolm, Brin Morgan, Sara Neely, Sandra Richardson, and Adam van der Zwan
The data hub launched in 2021 is continuing to grow and evolve. We are updating the platform as new data becomes available and adding new indicators. To date, we have approximately 85 on the platform. The platform allows us to track more quantitative indicators with more years of data than we ever could in the magazine. This frees up space in Vital Signs to explore other kinds of indicators and data.

As a result, you will see some of the platform indicators here on the regional data pages, as well as indicators that are unique to the magazine.
victoriafoundation.bc.ca/vital-victoria
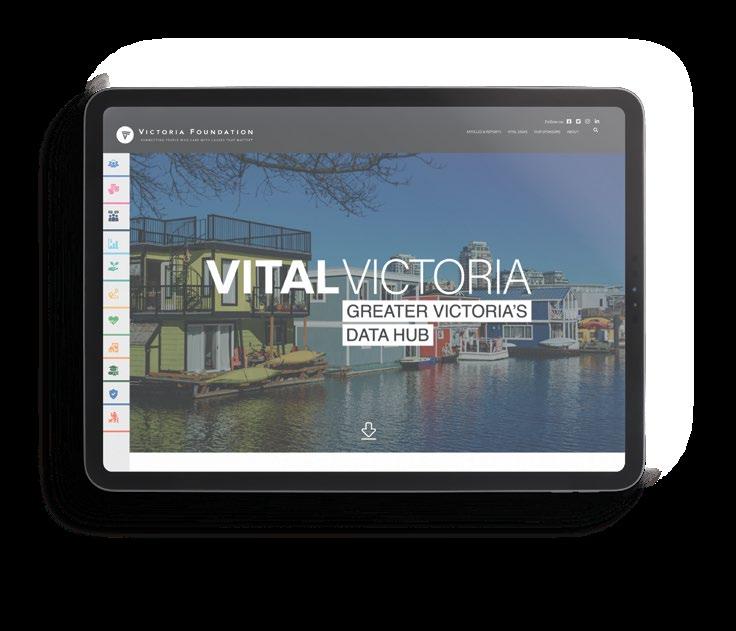
BELOW ARE SOME OF THE INDICATORS YOU WILL FIND ON OUR PLATFORM:
OUR COMMUNITY
Population
Median Age
Lone Parent Families
Visible Minorities
Immigrants
Life Expectancy
ARTS & CULTURE
Canada Council for the Arts Funding
Employment in Arts and Culture
BELONGING & ENGAGEMENT
Charitable Giving
Sense of Belonging
Hate-Motivated Crimes
Voter Turnout in Federal Elections
Women Candidates in
Federal Elections
ECONOMY
Employment Rate
Unemployment Rate
Farm Economy
ENVIRONMENTAL SUSTAINABILITY
Air Quality
Population Density
Household Water Conservation
Solid Waste Disposal
GETTING STARTED
Child Vulnerability Rate
Immigrant Employment Income
Immigrant Retention Rate
Net Migration
Youth Unemployment Rate
HEALTH & WELLNESS
Alcohol Consumption
Diabetes
Self-Reported Health
Self-Reported Mental Health
Perceived Life Stress
Smoking Rate
Heavy Drinking Rate
Physician to Population Ratio
Psychiatrist to Population Ratio
Unregulated Drug Deaths
HOUSING
Average Rents
Average Vacancy Rates
Core Housing Need
Dwelling Units Requiring Major Repairs
Gross Shelter to Income Ratio
Household Tenure
Housing Starts and Completions
LEARNING
High School Non-Completion Rate
Post-Secondary Attainment
Educational Equity
Education by Field of Study
Undergraduate Tuition Fees
SAFETY
Overall Crime Rate
Crime Severity Index
Crime Rates by Offence
Family Violence Victims
Intimate Partner Violence Victims
Youth Crime Rate
STANDARD OF LIVING
Gini Index
Households by Income Bracket
Median Family Income
Median Individual Income
Poverty Rates
Thank you to our Digital Platform Sponsor
The letter grades assigned to each issue area are from the citizen survey and refer only to the issue areas.
VITAL SIGNS CITIZEN SURVEY GRADE
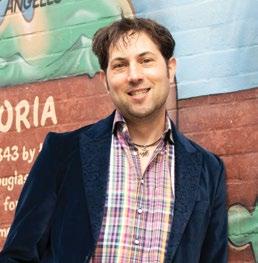
COLOURFUL BUSINESSES 2022 CELEBRATES MULTICULTURAL ENTREPRENEURSHIP

Last fall, Victoria hosted an innovative, inspirational, and inclusive conference celebrating Indigenous, Black, and immigrant entrepreneurs in the community. The event, a project of multiple organizations with funding through the Community Grants Program from the Victoria Foundation, is to showcase how people from diverse ethnicity and racial heritage make the area vibrant and relevant for both residents and visitors. At this event, First Nation, Black and immigrant-owned businesses have the opportunity to display their innovation, breadth and cultural richness.
Silvia Mangue Alene, the co-founder and President of Kulea Culture Society, said “The goal is to increase the capacity, viability and visibility of diverse businesses on Vancouver Island.”
With the success of the inaugural expo, Kulea Culture Society is now preparing for the second expo that will be taking place this fall.
For each indicator, empirical data is collected from established national, provincial and local data sources, including Statistics Canada, Province of British Columbia, and the Capital Regional District. Our emphasis is on reporting population-level or system-level data and, where this is not available, we include robust data at the cohort and/or organizational level.
REGIONAL
PHOTO AND CAPTION
The Victoria Foundation takes an active role in addressing issues of concern in our community. Often, these issues come to light as the result of survey findings and indicator data profiled in Victoria’s Vital Signs.
HeroWork Canada found significant benefits from renovating buildings used for charitable services in a study of infrastructure renewal projects completed between 2012 and 2021, including 15 in the CRD.
Social impacts included increased and higher-quality services, better client access, improved efficiency, and an enhanced ability to achieve organizational mission and goals. 95% of leaders surveyed said renovations enabled them to better meet their goals, and 89% said they were able to expand services.
Economic impacts included increased revenue, reduced costs, more economies of scale, increased human resources, and enhanced community service. 44% of leaders said they were able to attract new revenue sources or increase revenue, and 81% said renovations reduced maintenance and utility costs.
Note: In 2023, HeroWork Greater Victoria closed after 10 years, citing increased construction costs, reduced returns on fundraising, and financial losses on renovation projects due to changing market conditions. Since 2014, they had renovated 17 buildings for local charities with renovations valued at $8 million.
SUSTAINABLE DEVELOPMENT TARGETS
8.3: Support decent job creation, entrepreneurship, creativity and innovation, and growth of micro-, small- and medium-sized enterprises
COMMUNITY IN FOCUS
Watch for these short stories in the issue areas that present different kinds of local and BC data that complement the indicators and help support — and celebrate — collective action.
121

8.5: Achieve full and productive employment and decent work for everyone
8.9: Promote sustainable tourism that creates jobs and promotes local culture and products
Icons are placed next to indicators that are recognized by the UN Sustainable Development Goals (SDG) Monitoring
Framework and/or are considered
Canadian-equivalent or robust proxy SDG indicators. These indicators support specific targets associated with the SDGs that are listed at the bottom of each data page. See page 6 for more information.
The Sustainable Development Goals (SDGs) represent the world’s collective vision for a thriving and sustainable planet. Canada is one of 193 countries participating in this United Nations initiative. The SDGs are universal and apply to all people and communities everywhere. Within the 17 SDGs, there are 169 targets. Canada has signed on to achieving these goals at home and abroad. At the community level, the SDGs are an opportunity to focus and coordinate collective efforts to address problems beyond the community scale, such as climate change, which can only be addressed if communities and cities unite in common action. Visit globalgoals.org for more details.
31
GOAL 1 End poverty in all its forms everywhere.

N/A GOAL 2 End hunger, achieve food security, and promote sustainable agriculture.

18, 20, 21, 24, 26
10, 11, 24, 25, 32
13, 26, 27, 30, 31
GOAL 3 Ensure healthy lives and promote wellbeing for all at all ages.

GOAL 4 Ensure equitable, quality education and promote lifelong learning opportunities.

GOAL 5 Achieve gender equality and empower all women and girls.

17
N/A
GOAL 6 Ensure availability and sustainability of water and sanitation for all.


GOAL 7 Ensure access to affordable, sustainable, and modern energy for all.

7, 10, 11, 14, 15, 19, 30, 31
15
12, 14, 18, 20, 30
7, 10, 11,
12, 16, 17, 22, 23, 32, 33
16, 17
GOAL 10
Reduce inequality within and among countries.

GOAL 11
Make cities and human settlements inclusive, safe, resilient, and sustainable.

GOAL 12
Ensure sustainable consumption and production patterns.

GOAL 13
22
Take urgent action to combat climate change and its impacts.
GOAL 14
7
7, 16
13, 19, 26, 27
GOAL 8
Promote sustained, inclusive economic growth, full employment, and decent work for all.

GOAL 9
Build resilient infrastructure, promote sustainable industrialization, and foster innovation.

N/A
Conserve and sustainably use the oceans, seas, and marine resources.
GOAL 15
Protect and promote terrestrial ecosystems, forests, land, and biodiversity.


GOAL 16
Promote peaceful societies, accountable institutions, and access to justice for all.

GOAL 17
Strengthen global partnerships for sustainable development.

WHAT ARE THE BEST THINGS ABOUT GREATER VICTORIA?
According to this year’s survey, these are the 16 best things about the region, ranked by the percentage of respondents who selected them.
WHAT ARE THE MOST IMPORTANT ISSUES FACING GREATER VICTORIA TODAY?
According to this year’s survey, these are the region’s top 16 issues, ranked by the percentage of respondents who selected them.
THE BEST THING about Greater Victoria, the natural environment, is also the focus of two of the UN Sustainable Development Goals (SDGs). SDG #14, Life Below Water, speaks to conserving and sustainably using the oceans, seas and marine resources for sustainable development.

SDG #15, Life on Land, looks to protect, restore, and promote sustainable use of terrestrial ecosystems, sustainably manage forests, combat desertification, and halt and reverse land degradation and halt biodiversity loss.


THE MOST IMPORTANT ISSUE facing Greater Victoria, cost of living, is embodied in several SDGs, particularly #8, Decent Work and Economic Growth, which promotes inclusive and sustainable economic growth, full and productive employment, and decent work for all, and #11, Sustainable Cities and Communities, which aims to make cities and human settlements inclusive, safe, resilient, and sustainable.

Vital Signs citizen survey participants were asked a range of questions about their quality of life and feelings of connectedness to their community.
WHEN ASKED TO RATE THEIR OVERALL QUALITY OF LIFE, THE AVERAGE GRADE WAS
TOP 5 THINGS TO ADDRESS TO MAKE GREATER VICTORIA AN EVEN BETTER PLACE TO LIVE
AFFORDABLE HOUSING / MORE RENTAL OPTIONS
SOCIAL ISSUES (including mental health, homelessness, etc.)
76%
IMPROVE PUBLIC SAFETY
OF RESPONDENTS SAID THE AVAILABILITY OF AFFORDABLE RENTAL ACCOMMODATION TO MEET THEIR NEEDS IS BELOW AVERAGE OR POOR
70%
OF RESPONDENTS FEEL CONNECTED TO THE COMMUNITY IN GREATER VICTORIA
64%
IMPROVE PUBLIC TRANSPORTATION
MORE AFFORDABLE COST OF LIVING
OF RESPONDENTS SAID THEY ARE SATISFIED WITH THEIR WORK AND HOME LIFE BALANCE
66%
OF RESPONDENTS FEEL RESPECTED LIVING IN GREATER VICTORIA
SEE THE FULL SURVEY RESPONSES AT VICTORIAFOUNDATION.BC.CA/VITAL-SIGNS
DIVERSITY, EQUITY, AND INCLUSION IN GREATER VICTORIA
THE OVERALL GRADE FOR DIVERSITY, EQUITY, AND INCLUSION IN GREATER VICTORIA IS
TOP 3 ISSUES TO ADDRESS WHEN IT COMES TO DIVERSITY, EQUITY, AND INCLUSION
SOCIAL ISSUES (including mental health, homelessness, etc.)
AFFORDABLE HOUSING / MORE RENTAL OPTIONS
RACISM AND DISCRIMINATION
ACCORDING TO SURVEY RESPONDENTS
70%
agree there should be more opportunities to support crosscultural education and awareness.
41%
agree Black, Indigenous, and People of Colour have equal opportunities and are treated as equals.
56%
that identify as Black, Indigenous, and People of Color feel respected living in Greater Victoria.
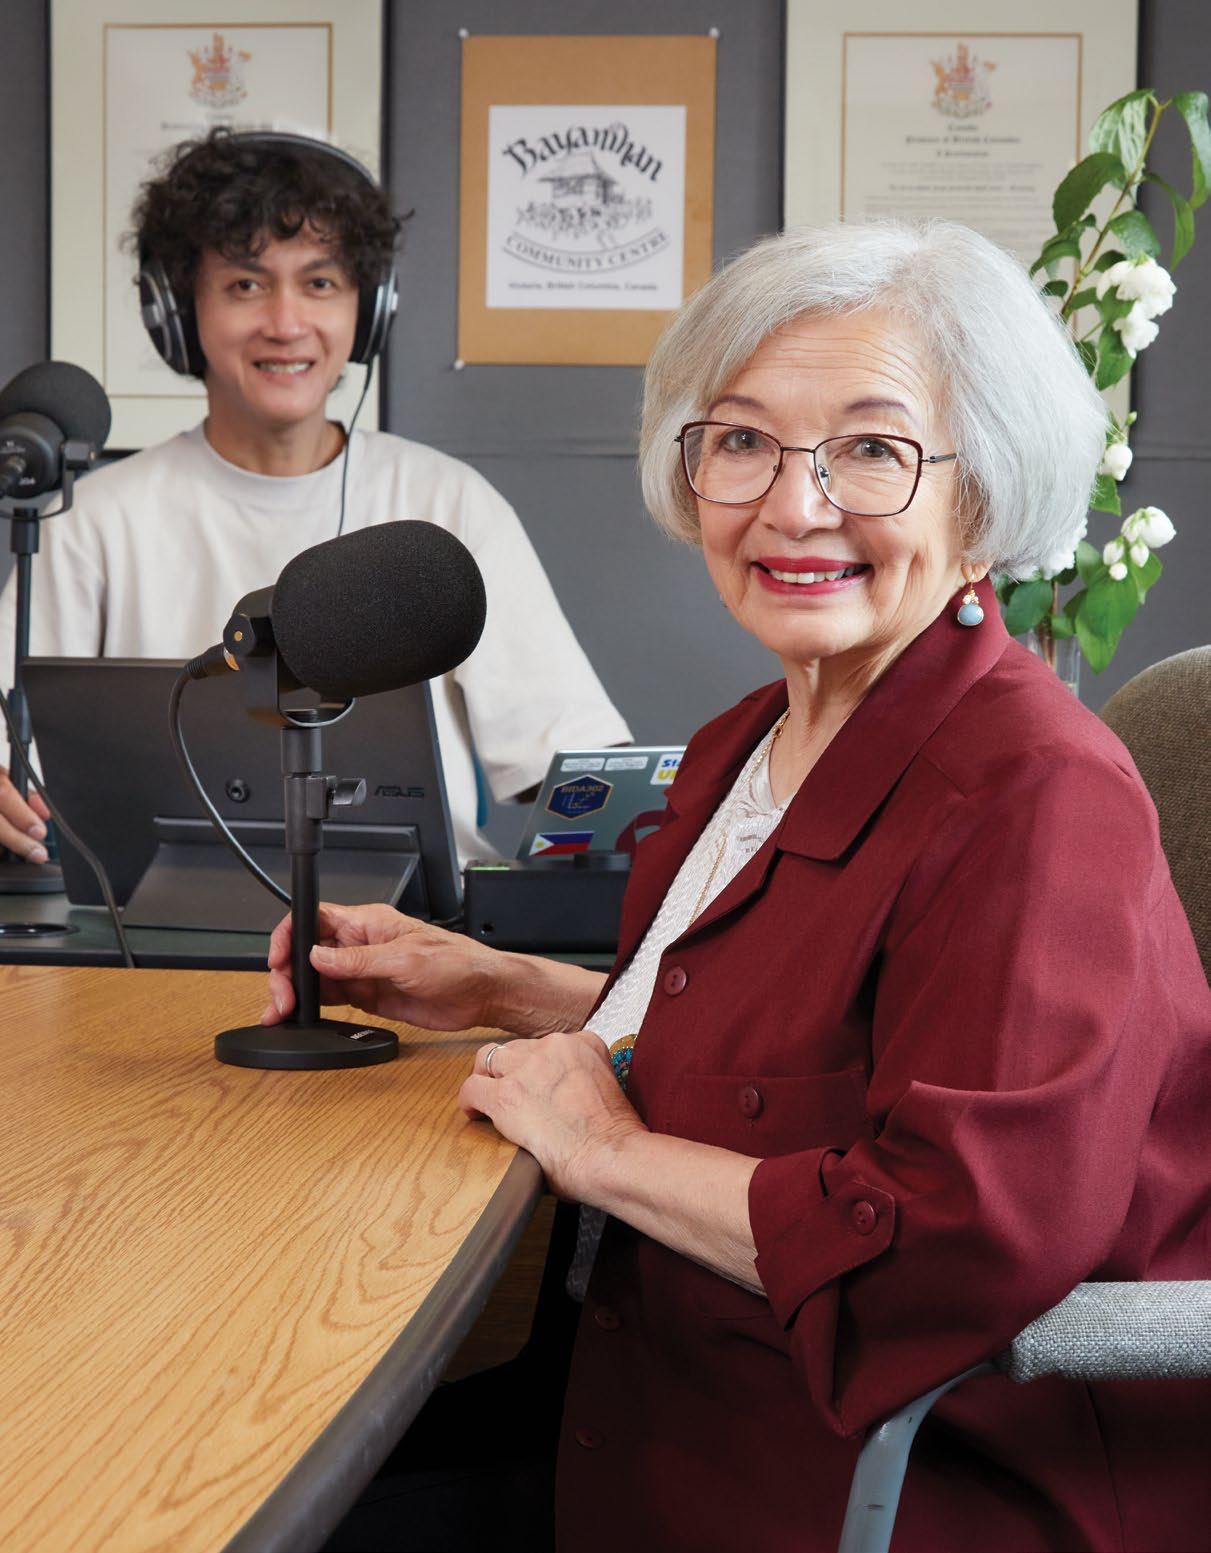
The Vital Victoria Podcast, hosted by Lucky Budd, features some of Greater Victoria’s most fascinating people and their stories of helping to create a vibrant, caring community. The conversations cover an eclectic mix of topics, all tied back to data and stats from the Vital Signs program. Listen to episodes at victoriafoundation.bc.ca/vital-victoria-podcast or subscribe on your favourite podcast platform.
The Victoria Foundation, in partnership with Coast Capital, hosts several Vital Conversations each year to discuss the challenges facing the region that are brought to light through the Vital Signs report. By bringing together community leaders and subject-matter experts from across Greater Victoria, we facilitate conversations that lead to solutions and meaningful action.
The Vital Signs and Vital Conversation program is led nationally by Community Foundations of Canada, but each community hosts their own conversations on relevant topics. To learn more about past Vital Conversations visit: victoriafoundation.bc.ca/category/vital-conversation
2023 FEATURE ARTICLE:


Our 2023 Vital Signs feature article explores the topic of how we can work together to move from hope to change. Using sports and the concept of physical literacy as an analogy, the article highlights the journey of turning the desire to move forward and grow into tangible change. Read the article on Vital Victoria at victoria-vital-signs.tracking-progress.org
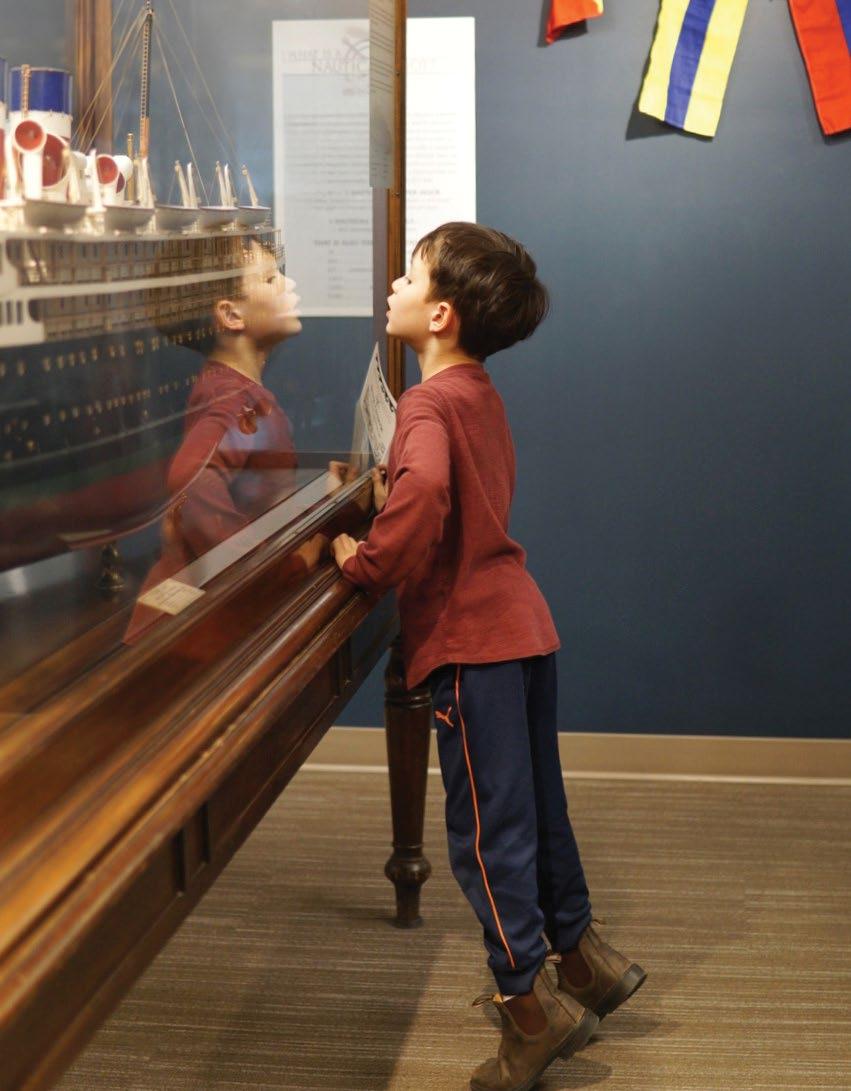
With over 35,000 ships’ plans, 2,000 maps and charts, and a 40,000+ object collection and archive, it’s obvious that the Maritime Museum of British Columbia is a key knowledge holder about history on the water. When the Victoria Foundation offered funds through the Community Grants Program, the Museum developed a three-part strategy to set its course. The first component was to develop a three-year strategic plan, revising their value statements and strategic priorities. The second was to continue efforts to make their services accessible to everyone in the community. And the final piece focused on building capacity and identifying ways to obtain a larger space to enable a stronger community impact.
Brittany Vis, Executive Director, shared, “We used some of the funds to help us offer honoraria to external folks presenting in our programs and events, like our Nautical Nights Speaker Series & Maritime Masterclasses. Providing an honoraria helps us bring in more diverse groups of people interested in learning the hidden secrets within the Museum’s collections.”
 CITIZEN SURVEY GRADE
INDIGENOUS LANGUAGES
2022 REPORT ON THE STATUS OF B.C. FIRST NATIONS LANGUAGES estimates there are:
34 DISTINCT, ACTIVELY USED FIRST NATIONS LANGUAGES IN BC
10,355
FIRST NATIONS LANGUAGE SPEAKERS
3,370 FLUENT SPEAKERS
6,985 SEMI-SPEAKERS
17,103 ACTIVE LANGUAGE LEARNERS, up from 3,106 in 2018, with 67% of learners under 25
Visit
2022 TOTALS ACROSS THE 12 GREATER VICTORIA PUBLIC LIBRARY BRANCHES
5.5 M Total Circulation
3.7M physical, 1.8M digital items
99,500
Public Computer Logins
SOURCE: GREATER VICTORIA PUBLIC LIBRARY
19,000 New Card Holders
3.0M Total Visits 1.4M in-person
14% of active cardholders in 2022
16,000 Total Program Participation
SENĆOŦEN,
Malchosen, Lekwungen, Semiahmoo, and T’Sou-ke
16 FLUENT SPEAKERS
181 LANGUAGE SPEAKERS 165 SEMI-SPEAKERS
523 ACTIVE LANGUAGE LEARNERS comprised of speakers and non-speakers
These dialects are learned in a variety of settings, including 2 language nests (full immersion pre-school), 5 Head Start programs, 3 other early childhood education programs, 1 First Nations school, 10 public schools, 5 adult language programs, and university courses.
The SȾÁUTW (Tsawout) and WJOȽEȽP (Tsartlip) communities each have one language nest. The WSÁNEĆ School Board offers SENĆOŦEN language immersion from pre-school through Grade 9 at the LE,NOṈET SCUL,ÁUTW Survival School.
SDG 8

IN 2021, OF THE GREATER VICTORIA LABOUR FORCE, AGED 15 YEARS AND OVER
4% WORKED IN ARTS, CULTURE, RECREATION AND SPORTS OCCUPATIONS up from 3.7% in 2016, and on par with BC (4.2%) and higher than Canada (3.1%) in 2021.
The Vancouver Island Regional Library (VIRL) serves Vancouver Island, Haida Gwaii, and the Central Coast. It operates 39 branches, including two in the capital region: Sidney/North Saanich and Sooke.
IN 2022, THE TWO BRANCHES RECORDED:
315,000 Total Circulation, 275,000 Physical Items and 40,000 Digital Items
14,400 Total Cardholders (33% new applicants)
7,900 Attendance at free library events
VIRL opened its state-of-the-art, 13,400 sq./ft. library in Sooke which won the merit award in the community institutional category at the 2022 Capital Region Commercial Building Awards.
SOURCE: VANCOUVER ISLAND REGIONAL LIBRARY
REGIONAL FUNDING
In 2022, the Capital Regional District (CRD) Arts and Culture Support Service distributed $2.6M in grants to 95 non-profit arts organizations and artist-led partnerships in the region, the most funded in a single year, of whom 13 were first time recipients.
IN 2022, CRD GRANT RECIPIENTS HOSTED
11,437 EVENTS IN THE REGION, a 15% increase over 2021, with over 1 MILLION participants and audience members.
4,301 ARTS WORKERS WERE EMPLOYED by operating grant recipients in 2022, including artists and full- and part-time staff, a 15% increase over 2021.
SOURCE: CAPITAL REGIONAL DISTRICT
FEDERAL FUNDING
SOURCE: STATISTICS CANADA
SOURCE: CAPITAL REGIONAL DISTRICT
4.7: Acquire appreciation of cultural diversity and culture’s contribution to sustainable development

to 167 recipients in the Victoria CMA, including 113 individuals, 7 groups, and 47 arts organizations. Grants ranged from $1,000 to $804,000.
$27,718 average grant received by individuals
$106,521 average arts organization grant
$73M AWARDED by the CCA in 2021/2022
to 1,243 artists, groups, and organizations in 108 communities in BC.
SOURCE: CANADA COUNCIL FOR THE ARTS
8.3: Support decent job creation, entrepreneurship, creativity and innovation, and growth of micro-, small- and medium-sized enterprises

11.4: Strengthen efforts to protect and safeguard the world’s cultural and natural heritage
11
Since 2001, the Philippine Bayanihan Community Centre, owned and operated by the Bayanihan Cultural and Housing Society, has been staffed by volunteers. The space is a community centre for education, support services for youth, seniors, new immigrants, caregivers and skilled workers. It also offers cultural, heritage and arts programs, and provides a venue for pursuit of creative interests and recreational activities for the general public. A commercial kitchen, hall, and parking area add revenue to the centre and helped the society pay off the mortgage within the first five years. The pandemic made it impossible for volunteers to maintain the centre, so when the community learned of the recovery grant from Victoria Foundation, they submitted an application and gained access to funds to bring in a paid staff member to manage the day-to-day operations.
“The recovery program was exactly what we needed to staff the center so we have consistency, regularity, and potential for progress,” shared Laila Pires, Treasurer of the Bayanihan Cultural and Housing Society.
“Our new staff member concentrated on making sure the recovery is safe, so we were able to start bringing in our members and others who want to experience everything the centre has to offer.”
TAX FILERS WHO MADE CHARITABLE DONATIONS IN 2021 GREATER VICTORIA
22% BRITISH COLUMBIA
ON PAR WITH 2020
SOURCE: STATISTICS CANADA
17%
18%
CANADA
SDG 16

2021 MEDIAN DONATION IN GREATER VICTORIA $500 ON PAR WITH LAST YEAR below BC ($520) well above the national median donation ($360) in 2021
35 HATE CRIMES REPORTED IN VICTORIA CMA in 2022
HOW
ORGANIZATIONS FARING IN POST-PANDEMIC BC?
A survey of 757 non-profits in BC, including 59 in the Capital Regional District, revealed that the majority of organizations are feeling overwhelmed and under pressure.
The 2023 State of BC’s Non-Profit Sector Report provides a temperature check on the sector and presents an analysis of the current contexts for non-profits operating on the ground in different regions of BC.
The report indicates that non-profits are doing more to meet increasing program and service demands from communities, while also doing more to take care of staff with increased wages and benefits. Over 75% of respondents report increasing demands for service, and 76% of respondents report increasing salaries and benefits for staff. However, revenues are staying the same as expenses are going up. While there is a sense of stabilization in the sector, organizations are concerned about sustainability in the face of increasing costs and staffing pressures.
83%
OF RESPONDENTS REPORTED HIGHER OVERALL EXPENSES.
The State of the Sector report series is a collaboration between Vantage Point, Vancouver Foundation, the City of Vancouver and the Victoria Foundation. Vancity Community Foundation and United Way BC joined the partnership in 2023.
SOURCE: VANTAGE POINT, VANCOUVER FOUNDATION, CITY OF VANCOUVER, VICTORIA FOUNDATION
SUSTAINABLE DEVELOPMENT TARGETS
5.5: Ensure women’s full and effective participation and equal opportunities for leadership at all levels of decision making in political, economic, and public life

RATE OF 8.4 PER 100,000 POPULATION
DOWN FROM 10.4 in 2021 and lower than the rate of 10.8 across all CMAs in 2022
HATE CRIME RATE IN THE REGION IS UP FROM 2018
33%
Police data on hate crimes reflect only those incidents that come to the attention of police and that are subsequently classified as hate crimes. Fluctuations in the number of reported incidents may be attributable to a true change in the volume of hate crimes, but also to changes in reporting by the public because of increased community outreach by police or heightened sensitivity after high-profile events.
SOURCE: STATISTICS CANADA
SDG 5
WOMEN IN LOCAL GOVERNMENT
WOMEN AS PROPORTION OF 2022 BC MUNICIPAL ELECTED OFFICIALS
OAK BAY
BC AVERAGE 38.5%
CENTRAL SAANICH
71%
14%
WOMEN AS PROPORTION OF CANDIDATES IN 2022 BC MUNICIPAL ELECTIONS
OAK BAY
METCHOSIN
SIDNEY
60%
60%
20%
Note: These are the highest and lowest rankings of the 13 municipalities in the capital region.
SOURCE: CIVICINFO BC
16.3: Promote the rule of law and ensure equal access to justice for all
16.10: Ensure public access to information and protect fundamental freedoms


Last fall, Victoria hosted an innovative, inspirational, and inclusive conference celebrating Indigenous, Black, and immigrant entrepreneurs in the community. The event, a project of multiple organizations with funding through the Community Grants Program from the Victoria Foundation, is to showcase how people from diverse ethnicity and racial heritage make the area vibrant and relevant for both residents and visitors. At this event, First Nation, Black and immigrant-owned businesses have the opportunity to display their innovation, breadth and cultural richness.
Silvia Mangue Alene, the co-founder and President of Kulea Culture Society, said “The goal is to increase the capacity, viability and visibility of diverse businesses on Vancouver Island.”
With the success of the inaugural expo, Kulea Culture Society is now preparing for the second expo that will be taking place this fall.
UNEMPLOYMENT RATE
THE UNEMPLOYMENT RATE AMONG PEOPLE AGED 15 AND OVER IN 2022
4%
GREATER VICTORIA DOWN FROM 5% IN 2021
5% BRITISH COLUMBIA
5% CANADA
The unemployment rate among women in the region in 2022 was 4%, higher than the rate for men (3%).
SOURCE: STATISTICS CANADA
EMPLOYMENT RATE
THE EMPLOYMENT RATE AMONG PEOPLE AGED 15 AND OVER IN 2022
61%
GREATER VICTORIA UP FROM 60% IN 2021
62% BRITISH COLUMBIA
62% CANADA
The employment rate among women in the region in 2022 was 57%, lower than the rate for men (65%).
SOURCE: STATISTICS CANADA
RENOVATING CHARITY BUILDINGS MAKES A MAJOR DIFFERENCE
CANADA’S CHARITABLE SECTOR CONTRIBUTES
$192 billion IN ECONOMIC ACTIVITY ANNUALLY & EMPLOYS 2.4 million PEOPLE.
SOURCE: IMAGINE CANADA
HeroWork Canada found significant benefits from renovating buildings used for charitable services in a study of infrastructure renewal projects completed between 2012 and 2021, including 15 in the CRD.
Social impacts included increased and higher-quality services, better client access, improved efficiency, and an enhanced ability to achieve organizational mission and goals. 95% of leaders surveyed said renovations enabled them to better meet their goals, and 89% said they were able to expand services.
Economic impacts included increased revenue, reduced costs, more economies of scale, increased human resources, and enhanced community service. 44% of leaders said they were able to attract new revenue sources or increase revenue, and 81% said renovations reduced maintenance and utility costs.
Note: In 2023, HeroWork Greater Victoria closed after 10 years, citing increased construction costs, reduced returns on fundraising, and financial losses on renovation projects due to changing market conditions. Since 2014, they had renovated 17 buildings for local charities with renovations valued at $8 million.
SOURCE: HEROWORK CANADA
8.3: Support decent job creation, entrepreneurship, creativity and innovation, and growth of micro-, small- and medium-sized enterprises
% POPULATION (15 YEARS +) WHO ARE UNEMPLOYED
% POPULATION (15 YEARS +) WHO ARE EMPLOYED
HOTEL ROOMS
GREATER VICTORIA AVERAGE RATES IN 2022 COMPARED TO 2021
69% OCCUPANCY RATE UP FROM 50%
$236 DAILY ROOM RATE UP FROM $187
$163 REVENUE PER AVAILABLE ROOM UP FROM $93
The Victoria Conference Centre recorded a 336% increase in delegate days in 2022, with 87,300 days compared to 20,000 in 2021.
SOURCE: CHEMISTRY CONSULTING GROUP
SDG 9
AIR AND FERRY PASSENGER VOLUME
BC FERRIES REPORTED INCREASES IN 2022 COMPARED TO 2021
52% PASSENGER TRAFFIC
31% VEHICLE TRAFFIC
296% BUS TRAFFIC Tsawwassen — Swartz Bay
VICTORIA INTERNATIONAL AIRPORT REPORTED INCREASES IN 2022 COMPARED TO 2021
121%
FLIGHT PASSENGER VOLUME
SOURCE: CHEMISTRY CONSULTING GROUP
8.5: Achieve full and productive employment and decent work for everyone
8.9: Promote sustainable tourism that creates jobs and promotes local culture and products
1.5M
TOTAL PASSENGERS UP FROM 674,000
9.1: Develop sustainable, resilient, and inclusive infrastructures


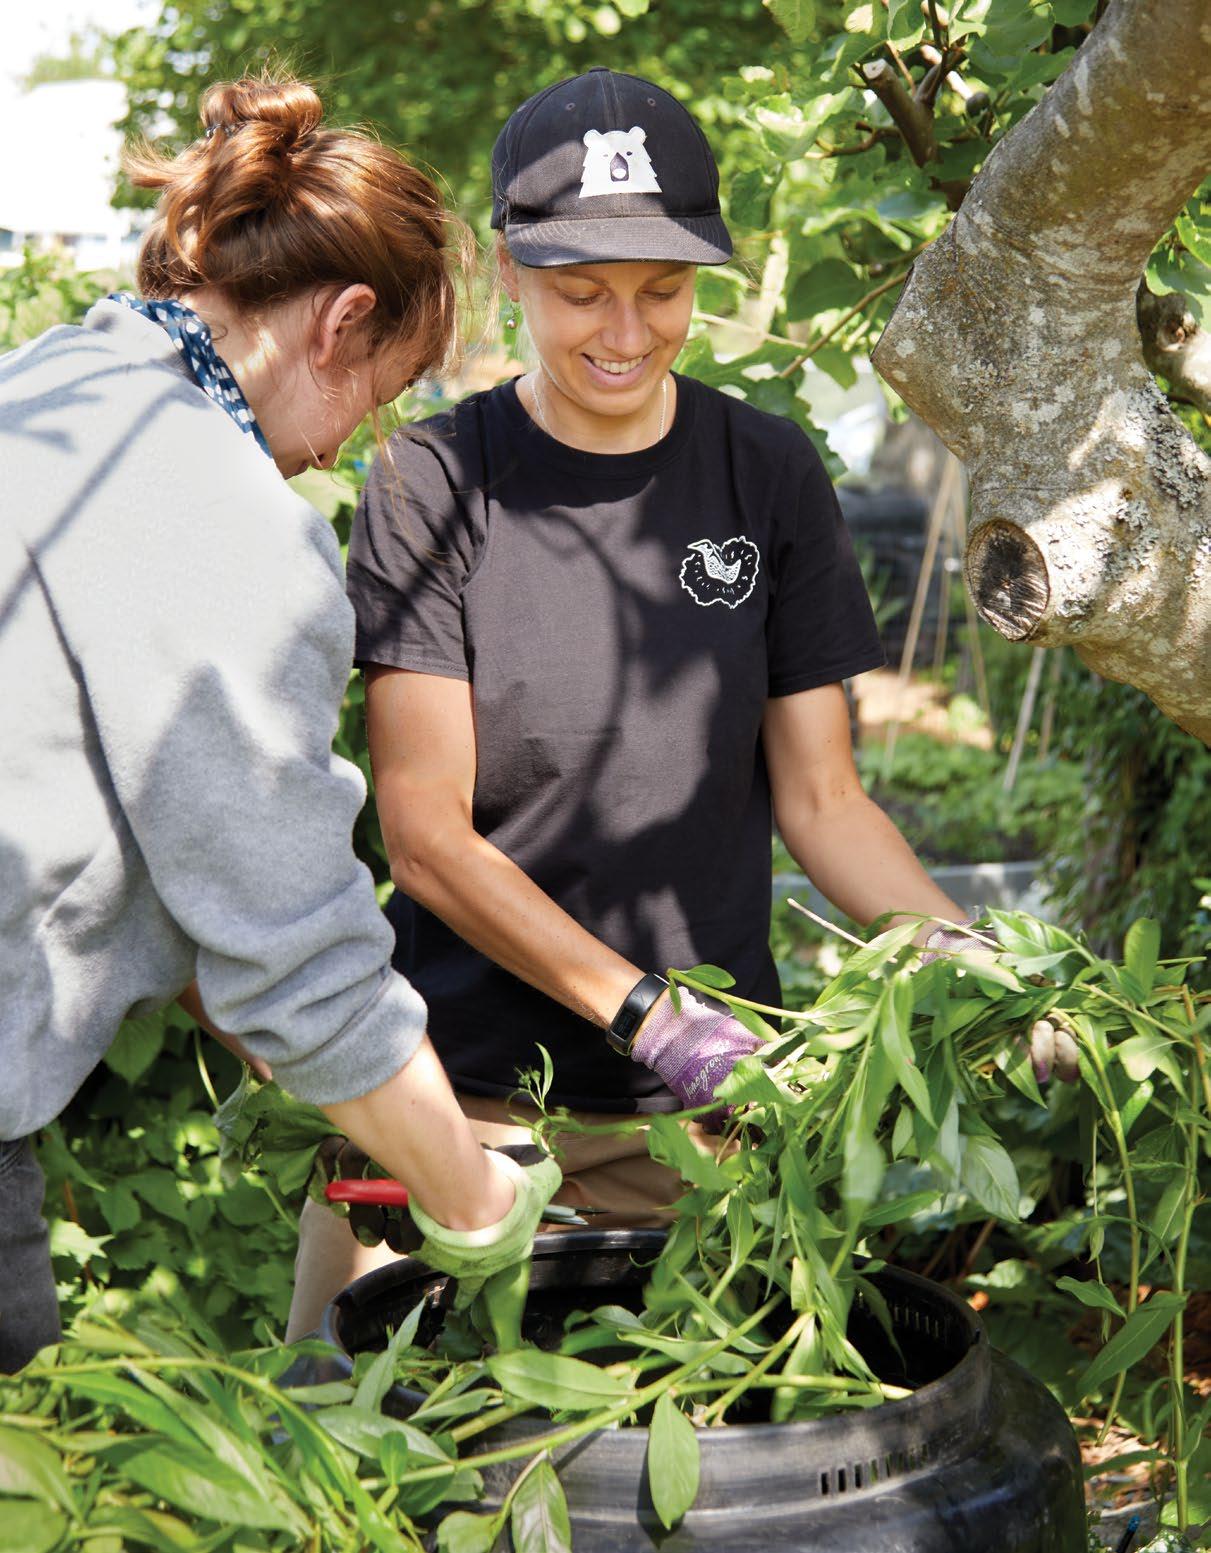
For the past 31 years, the Compost Education Centre has connected people throughout Victoria with simple, land-based, resiliency practices. They provide compost, waste diversion, and ecological gardening education to people interested in getting their hands dirty. Initially founded by the Fernwood Community Association to provide composting education and resources to the public, the centre has expanded to deliver education and resources around composting, organic gardening, and conservation work throughout the Capital Regional District.
Through the Victoria Foundation Vital Youth program, launched in 2003 to create a philanthropic mindset for students, learners at Pearson College UWC donated funds to support the Compost Education Centre.
Executive Director Claire Remington shared, “I think about composting from the circular perspective; you have your food waste, which too often goes into the landfill, but by composting, you can recirculate the nutrients from the food waste into something you can use to grow more food. It’s not just about producing food. It’s about how we can use compost to steward and conserve the land around us.”
29% OF HOUSEHOLDS
SOURCE: STATISTICS CANADA
In 2019, 29% of households in the Victoria CMA engaged, without pay, in activities aimed at conservation or protection of the environment or wildlife, up from 26% in 2017 and 25% in 2015, above 26% for BC and 22% for Canada in 2019.
In 2021, Ocean Diagnostics, in partnership with Environment and Climate Change Canada, developed microplastics sampling and analysis protocols and technology for community science applications.
Fifty-one volunteers used the tools to sample 10 Greater Victoria shorelines monthly between April and November 2021. A total of 240 sand samples were processed using Saturna Imaging System technology, with a subset analyzed for chemical identity.
The analysis found 2,426 microplastic particles: 81% foam, 9% fragments, 7% lines, 2% films and 2% pellets.
Microplastic particles were most abundant at beaches with marinas. The dominant particle was polystyrene foam, the major type of litter removed from BC beaches and one of the most common types of global shoreline litter.
The project led to the development of a Community Science Toolkit with simple protocols and technology to help community scientists produce valuable information on microplastic pollution to drive local action.
SOURCE: OCEAN DIAGNOSTICS AND ENVIRONMENT AND CLIMATE CHANGE CANADA
6.6: Protect and restore water-related ecosystems
In 2021, the region’s two monitoring stations, Victoria-Topaz and Colwood, recorded annual average concentrations of fine particulate matter (PM2.5) of 6.5 and 5.9 micrograms per cubic metre (µgm³) respectively, below the provincial annual benchmark of 8 µgm³.
6.5
5.9 µgm3 COLWOOD
8 µgm3 PROVINCIAL ANNUAL BENCHMARK
In 2021, due largely to particles from wildfire smoke, the PM2.5 levels exceeded the provincial 24-hour benchmark of 25 µgm³ for
Of all the air pollutants, PM2.5 has the greatest impact on human health. Major sources of PM2.5 in BC include:
• seasonal wildfires
• residential wood combustion
• prescribed burning
• marine vessels
• heavy-duty diesel vehicles
• mining and pulp and paper sectors
In recent years, wildfires in Canada have increased in overall size, magnitude, and frequency. This year (2023) is the most destructive wildfire season on record in BC for area burned, after 2018, 2017 and 2021, respectively. In each of those three years, there were record setting levels of PM2.5.
SOURCE: BC LUNG FOUNDATION AND BC WILDFIRE SERVICE
Drought is a recurrent climate feature involving an extended deficiency of precipitation, resulting in water shortage. It may be caused by insufficient snow accumulation, hot and dry weather, and/or a delay in rainfall. BC monitors drought conditions across 34 watershed basins using a 0-5 scale. At level 5, conditions are exceptionally dry and adverse socio-economic or ecosystem impacts are almost certain.
As of September 7, 2023, the latest available data at time of publication, 27 of BC’s 34 basins (79%) were at levels 4 or 5.
Greater Victoria sits within the East Vancouver Island (EVI) basin which had been at level 5 for 9 weeks straight. During the same period in 2022, the EVI basin reached level 3 for 3 weeks and did not reach level 5 until later in the year and for less time.
SOURCE: BC MINISTRY OF FORESTS
11.6: Reduce adverse environmental impact of cities
12.5: Reduce waste generation through prevention, reduction and recycling


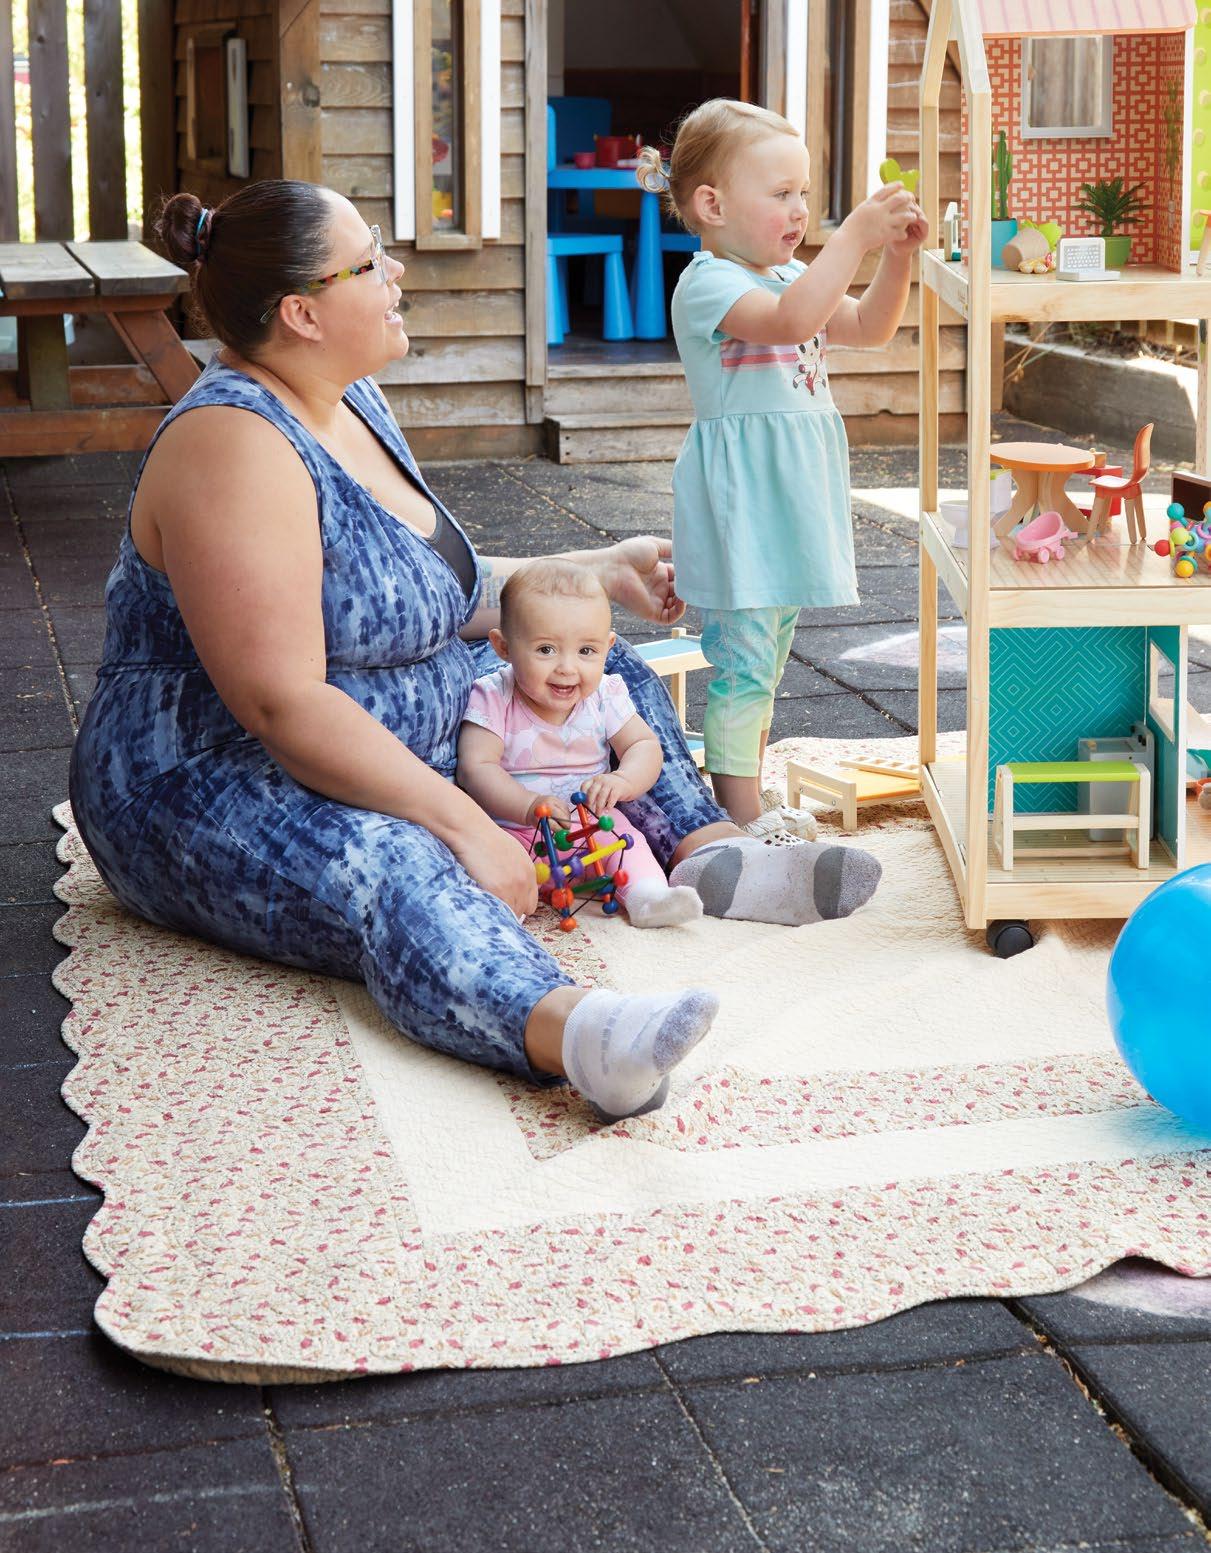
In 1984, a group of young moms in Sooke got together to discuss the parenting challenges they were experiencing. They incorporated to become the Sooke Family Resources Society, a grassroots social service agency serving the Sooke community. Since then, the organization has expanded to cover the communities from the Highlands to Port Renfrew. With funding from the Victoria Foundation through the Community Grants Program and public donations, the society has developed a prenatal program to provide pregnancy education, pre- and postnatal support, and outreach services to expectant families.
“The program uses a tiered support model,” explained Children and Family Services Program Manager Daphne Raymond. “We have free outreach services for people to self-select as needed and traditional prenatal classes with a sliding fee scale. Folks who can afford the classes help pay for those who are subsidized.” In addition to education and support, the program ensures that all new parents receive a baby bag, filled with essentials for the baby and parents and a handcrafted quilt from the Sooke Quilters. “Everyone who has a baby within our prenatal program gets a baby bag. It’s not a necessity, but it shows the care from the community.”
TOTAL NET MIGRATION IN GREATER VICTORIA
BETWEEN JULY 1, 2021 AND JUNE 30, 2022
Higher than the previous year (5,538), with a larger share coming from other countries (56% vs 4%) and smaller shares from within BC (11% vs 24%) and other provinces (34% vs 71%) compared to 2020/21.
In 2021/22, 1,579 young people, aged 20-34 years, migrated to Greater Victoria from other provinces, down from 1,695 the year before, and 552 young people came here from other parts of BC, down from 573 in 2020/21.
SOURCE: STATISTICS CANADA
SDG 8
YOUTH UNEMPLOYMENT
UNEMPLOYMENT RATE FOR YOUTH, 15-24 YEARS, IN 2022
8% GREATER VICTORIA ON PAR WITH 2021
9% BRITISH COLUMBIA 10% CANADA
POPULATION (15-24 YEARS) WHO ARE UNEMPLOYED
NUMBER OF CHILDREN AND YOUTH IN CARE AS OF MARCH 31, 2023
SOURCE: STATISTICS CANADA
IMMIGRANT EMPLOYMENT INCOME
In 2020, the median employment income of immigrant taxfilers in Greater Victoria three years after their admission year.
$38,400 MEDIAN INCOME
UP FROM 2019 ($35,200) AND 2018 ($36,500)
$36,400 BRITISH COLUMBIA $32,700 CANADA
Note: As of 2020, COVID-19 government income support benefits are included in taxfiler income estimates. Income values are adjusted to 2020 constant dollars.
SOURCE: STATISTICS CANADA
8.6: Reduce share of youth not in employment, education or training
538 TOTAL
62% Indigenous
The rate of children and youth in care in BC was 5 per 1,000 population, aged 0-18 years, in 2023. For Indigenous children and youth in BC, the rate was 34 per 1,000 population.
CARE PLAN COMPLETION RATE IN SOUTH VANCOUVER ISLAND
AS OF MARCH 31, 2023
OVERALL
IN BC
100% NON-INDIGENOUS
92% INDIGENOUS
78%
Care plans are critical to accessing services. The completion rate is based on children and youth who were in care for six months or longer.
CHILDREN AND YOUTH ADMITTED INTO CARE
45% Indigenous
YOUTH AGED OUT OF CARE
4,875 BRITISH COLUMBIA 66% Indigenous 177 35
14 Indigenous
Provincially, 1,965 children and youth were admitted into care in 2021/22, of whom 52% were Indigenous, and 413 youth aged out of care, including 227 Indigenous youth.
SOURCE: BC MINISTRY OF CHILDREN AND FAMILY DEVELOPMENT
OF IMMIGRANT TAXFILERS IN 2020 WHO CONTINUED TO RESIDE IN GREATER VICTORIA 3 YEARS AFTER CHOOSING TO LIVE HERE UPON ADMISSION TO CANADA
75%
similar to 2018 & 2019
90% BRITISH COLUMBIA 87% CANADA
SOURCE: STATISTICS CANADA
The year of admission is when an immigrant first obtained landed immigrant or permanent resident status. This may or may not be the same as the year of arrival.
16.2: End abuse, exploitation, trafficking and violence against children
When your mouth hurts, focusing on anything beyond the constant throb and dull ache is challenging. As a student, you might lash out at others, be unruly in class, and even earn the label of problem child. This scenario led Heather Burkett, former District Principal for Saanich, and Dr. Mitra Hashemi of Sidney Coast Dental Care, to form Oral Care for Children and Adolescents (ORCCA). “We serve children,” explained Heather. “Any child who is a resident of BC, including refugees from Syria, Sierra Leone, and Ukraine, as well as First Nations children and patients from low-income families throughout Greater Victoria.” Today, the non-profit dental clinic provides safe, gentle, and high-quality dental care to youth and children in the region by charging nearly 30% less than what the British Columbia College of Oral Health Professionals recommends and leveraging available grants and funding sources to help those who can’t afford the reduced rates. ORCCA has been operating since 2013 and performed more than 1000 procedures both last year and this year.

FAMILY PHYSICIANS IN 2021
783 SOUTH VANCOUVER ISLAND
Rate of 181 per 100,000 population
up from 746 family physicians and a rate of 175 per 100,000 population in 2020
BC 136 per 100,000
CANADA
Greater Victoria was one of the top three cities in BC where unregulated drug deaths occurred in 2022 (after Vancouver and Surrey).
UNREGULATED DRUG DEATHS IN 2022
SPECIALIST PHYSICIANS IN 2021
677 SOUTH VANCOUVER ISLAND
Rate of 157 per 100,000 population
up from 638 family physicians and a rate of 150 per 100,000 population in 2020
Family physicians include general practitioners, family medicine specialists, and emergency family medicine specialists certified by the College of Family Physicians of Canada.
BC 122 per 100,000
124 per 100,000 CANADA
122 per 100,000
Specialist physicians are certified by the Royal College of Physicians and Surgeons of Canada and/or Collège des Médecins du Québec.
SOURCE: CANADIAN INSTITUTE FOR HEALTH INFORMATION
SDG 3
DIABETES
7%
In 2020/21, the age-standardized prevalence rate, or proportion of people, age one and older, living with diabetes, excluding gestational diabetes, in South Vancouver Island, was 7%, or 38,185 people. This rate has remained stable over the past five years. In BC, the prevalence rate was 9% in 2020/21.
SOURCE: BC CENTRE FOR DISEASE CONTROL
AVERAGE WAIT TIME FOR WALK-IN CLINICS IN 2022
In 2022, Greater Victoria had the second longest walk-in clinic wait time in Canada, an improvement over 2021’s top Canadian wait time of 161 minutes, according to the Medimap Walk-in Clinic Wait Time Index.
AVERAGE WAIT TIME TO SEE A DOCTOR AT A WALK-IN CLINICS IN 2022
137 min
GREATER VICTORIA
While all provinces saw an increase in average wait times in 2022, Ontario had the lowest at 25 minutes.
Approximately 70% of walk-in clinics across Canada use Medimap to share their wait times. Wait times are updated by clinic staff every 30 minutes on average. Medimap currently operates in the following provinces: British Columbia, Alberta, Saskatchewan, Manitoba, Ontario and Nova Scotia.
SOURCES: MEDIMAP
SUSTAINABLE DEVELOPMENT TARGETS
175
2,383
SOUTH
GREATER VICTORIA UP FROM 141 IN 2021
BRITISH COLUMBIA UP FROM 2,304 IN 2021
SOURCE: BC CORONER'S SERVICE
SDG 3
VANCOUVER ISLAND UP
39.7
44.8
RATE OF DEATHS PER 100,000 SOUTH VANCOUVER ISLAND UP FROM 33.3 IN 2021
RATE OF DEATHS PER 100,000 IN BC UP FROM 44.2 IN 2021
Fentanyl was detected in 87% of BC’s unregulated drug deaths in 2022 and benzodiazepines were detected in 28%, up from 26% in 2021. These sedativetype of drugs do not respond to naloxone and create life-saving challenges for first responders. Unregulated drug deaths are the leading cause of death for people in BC ages 18 to 59.
ALCOHOL CONSUMPTION PER CAPITA
ESTIMATED ANNUAL ALCOHOL CONSUMPTION PER CAPITA IN 2022
10.6L
SOUTH VANCOUVER ISLAND
9.2L BRITISH COLUMBIA
8.1L CANADA in 2021/22
Data are reported in litres of absolute alcohol per person. One litre of absolute alcohol equals 58.7 standard drinks*
The current South Vancouver Island consumption averages out to 623 standard drinks per person, over the age of 15, including non-drinkers.
*One standard drink equals 17.05 ml of pure alcohol, or a 341 ml (12 oz) serving of 5% beer, cider or cooler, a 142 ml (5 oz) serving of 12% wine, or a 43 ml (1.5 oz) serving of 40% spirits.
SOURCE: CANADIAN INSTITUTE FOR SUBSTANCE USE RESEARCH
SDG 3
CHILDHOOD IMMUNIZATIONS
IMMUNIZATIONS OF CHILDREN IN SOUTH VANCOUVER ISLAND IN 2020
of two-year-olds were up to date with routine immunizations for their age, above the BC rate of 73%. Coverage in South Vancouver Island rises to 85% for up-to-date immunizations minus the booster shot (i.e., a scheduled vaccine dose given at 18 months of age for specific diseases). The childhood immunization rate for 2-year-olds in South Vancouver Island has remained stable over the past five years.
65%
of seven-year-olds were up to date with routine immunizations, below the provincial coverage rate of 69%. The childhood immunization rate for 7-year-olds in South Vancouver Island has declined over the past five years.
SOURCE: BC CENTRE FOR DISEASE CONTROL
3.4: Reduce premature mortality from non-communicable diseases and promote mental health and wellbeing

3.5: Strengthen prevention and treatment of substance use problems
Visit to explore more data 21
Addressing Victoria’s housing crisis requires strategic, insightful, and creative options to bring climateready, community-owned affordable rental units to the market. The Vancity Affordable Housing Program + Accelerator Fund, supported by investments from Victoria Foundation, helps nonprofit housing providers, committed community groups, Indigenous organizations, and cooperatives throughout the province access the necessary funds to leverage property they own and convert it into additional housing for the community.
Irene Gannitsos, Director of Strategic Investment at Vancity Community Foundation, explained, “The program provides grant capital that allows organizations to craft viable business plans for development or acquisition. Then, through patient, low-cost loans, the organization can carry out the expensive work of municipal zoning approvals, detailed construction budgets, securing financing, necessary studies, and everything that’s required to get that project to construction and completion. And in the context of the climate crisis, we're working to make sure projects are climate-resilient and energy-efficient while remaining affordable to a diverse range of low and moderate income households.”
HOUSING SALES AND PRICES
PROPERTIES SOLD IN GREATER VICTORIA IN MAY 2023
775
UP FROM MAY 2022
SOURCE: VICTORIA REAL ESTATE BOARD
The ratio of sales to active listings was 46% in May 2023, making Greater Victoria a seller’s market, with upward pressure on prices reflecting growing demand coupled with ongoing lack of inventory
RENTS AND RENTAL VACANCY
AVERAGE VACANCY RATES IN GREATER VICTORIA IN OCTOBER 2022 for purpose-built rental apartments (i.e.,units built as long-term rental housing)
ALL UNIT TYPES 1.5% UP FROM 1% IN 2021
LOWEST VACANCY RATE 1.1% BACHELOR UNITS
HIGHEST VACANCY RATE 2% 3+ BEDROOM UNITS
AVERAGE APARTMENT RENT IN OCTOBER 2022
ALL UNIT TYPES $1,467
UP 7.5% FROM $1,332 IN 2021
3+ BEDROOM $2,144
The supply of purpose-built rentals grew by 1,328 units in 2022, compared to 661 units in 2021, with most of the new supply in the Westshore in 2022.
SOURCE: CANADA MORTGAGE AND HOUSING CORPORATION
RENTAL HOUSING INDEX
OF 67,695 RENTER HOUSEHOLDS IN THE CAPITAL REGION
16% (10,725) SPEND MORE THAN 50% OF THEIR INCOME ON RENT AND UTILITIES
putting them at increased risk of homelessness, according to the Canadian Rental Housing Index, updated with 2021 Census data.
8% (5,170) LIVE IN OVERCROWDED CONDITIONS AND 6% (4,115) LIVE IN UNITS NEEDING MAJOR REPAIRS.
In British Columbia, 16% of renter households spend more than 50% of their income on rent and utilities, the highest proportion in Canada, with Ontario and Nova Scotia close behind at 15% and 13%, respectively.
SOURCE: BC NON-PROFIT HOUSING ASSOCIATION
SUSTAINABLE DEVELOPMENT TARGETS
MEDIAN SALE PRICES IN MAY 2023
SINGLE-FAMILY HOME
$1,174,950
DOWN 6% FROM $1,250,000 IN 2022
TOWNHOUSES
$785,000
DOWN 2% FROM $800,000 IN 2022
On the night of March 7, 2023, at least 1,665 individuals were experiencing homelessness in the region, according to the 2023 Greater Victoria Point-in-Time Homeless Count. This count is a community-based snapshot of individuals experiencing sheltered and unsheltered homelessness at a single point in time. It is considered an underestimate of homelessness on a given night.
CONDOS
$560,000
DOWN 6% FROM $598,000 IN 2022
242 UNSHELTERED
282 EMERGENCY SHELTER
85 COUCH SURFING
410 PUBLIC SYSTEM
601 TRANSITIONAL HOUSING
45 SPENT THE NIGHT IN UNKNOWN SLEEPING LOCATIONS
SOURCES: CAPITAL REGIONAL DISTRICT, COMMUNITY SOCIAL PLANNING COUNCIL OF GREATER VICTORIA, ABORIGINAL COALITION TO END HOMELESSNESS, ALLIANCE TO END HOMELESSNESS IN THE CAPITAL REGION, UNIVERSITY OF VICTORIA
In October 2022, Greater Victoria had the fourth highest two-bedroom rental wage of Canada’s 37 census metropolitan areas at $34.85/hr—after Vancouver, Toronto, and Ottawa—more than twice the BC minimum wage at the time ($15.65/hr). That means two full-time minimum wage workers cannot rent a two-bedroom apartment without spending more than 30% of their combined income on housing.
The rental wage is the hourly wage that a full-time worker must make to be able to rent an average-priced two-bedroom apartment using no more than 30% of their pre-tax income. Two bedrooms are the most common rental type in Canada at 50% of all purpose-built units.
SOURCE: CANADIAN CENTRE FOR POLICY ALTERNATIVES
GROSS SHELTER COST TO INCOME RATIO
17%
In 2020, 17% of owner households in Greater Victoria spent more than 30% of average total income on shelter costs (e.g., mortgage payments, property taxes, and condominium fees, along with the costs of electricity, heat, water, and other municipal services),
down from 22% in 2015, and lower than BC (19%) but higher than Canada (15%) in 2020.
Note: The 2020 ratio uses income data from the 2021 Census for the reference year 2020. Government transfers in 2020 included COVID-19 income support benefits. These benefits are reflected in 2020 household incomes.
SOURCE: STATISTICS CANADA
11.1: Access to adequate, safe and affordable housing for all

At the Khalsa Diwan Society of Victoria, local seniors can be part of an interfaith activity group that meets regularly to enjoy various activities, such as special screenings at the University of Victoria and field trips to local communities to see favourite attractions, like the Chemainus murals or the BC Forest Discovery Centre in Duncan. Or they can simply participate in regular activities at the Khalsa Diwan Society: playing cards and socializing or joining workshops to address personal safety and fraud concerns, hosted by local members of the police.
Volunteering is another opportunity available to members of the Seniors Social Activity Group. Hardip Sahota, President of the Khalsa Diwan Society of Victoria, shared, “This group isn’t just for socializing. Most of our members are over 55 and physically active. They help with weddings, funerals, and other events held at the temple. It’s a very healthy community, where everyone works together.”

In 2022/23, for students that were on-track or extending for their grade in literacy and numeracy:
Three of the region’s four school districts (SD) reported grade 4 all-student literacy and numeracy rates that surpassed BC rates.
Greater Victoria and Sooke SDs fell below provincial all-student rates for grade 7 literacy and numeracy.
Sooke SD fell below BC rates for literacy and numeracy in grades 4 and 7, for both Indigenous and all students.
Gulf Islands SD
grade 7 Indigenous student numeracy rate was higher than the BC all-student numeracy rate and higher than all-student numeracy rates in three of the four SDs.
Saanich SD
reported a disparity between all-student and Indigenous student literacy rates in grades 4 and 7, with Indigenous literacy rates well below BC Indigenous rates.
Small numbers have been masked to protect confidentiality.
% GRADE 4 AND 7 STUDENTS ON-TRACK OR EXTENDING IN LITERACY FOR THEIR GRADE, 2022/23
SDG 4
In 2021/22, the six-year high school completion rate in the region’s four school districts was close to the provincial rate (94%) for non-Indigenous students, with the Gulf Islands on par and lower rates in Sooke (93%), Greater Victoria (92%) and Saanich (87%). For Indigenous students, the completion rate in the Gulf Islands (85%) was well above the BC rate (75%), with lower rates in Sooke (73%), Greater Victoria (62%) and Saanich (56%). The completion rate is the proportion of first-time Grade 8 students who graduate high school after six years with a BC Certificate of Graduation ("Dogwood") or a BC Adult Graduation Diploma ("Adult Dogwood").
% GRADE 8 STUDENTS COMPLETING HIGH SCHOOL WITHIN SIX YEARS, 2019/20, 2020/21 AND 2021/22
% GRADE 4 AND 7 STUDENTS ON-TRACK OR EXTENDING IN NUMERACY FOR THEIR GRADE, 2022/23
SOURCE:
4.1: Ensure all complete primary and secondary education
4.6: Achieve literacy and numeracy
Community has long been a source of support for many social concerns, and through the Fund for Gender Equality from Victoria Foundation, the Rainbow Health Cooperative has developed the Three Mothers Medicine Camps. This cross-generational ecosystem of programs provides support and connection in a safe and caring environment. Programs in the camp include All Gender Birthing, Living Eldership Arts & Crafts, and Betwix’d.
“It’s easier to reduce and eliminate trauma than to deal with the aftereffects of it,” explained ChrŸs Tei, Executive Director for the Rainbow Health Co-operative. “These monthly sessions use community to be curative for trauma-related disorders. The camps will cover prenatal care in the morning, followed by a shared lunch at noon. Then there is an arts and crafts program for elders, and Betwix’d — like Girl Guides for diverse people — in the late afternoon. Eventually, there will be crossover activities between generations, where we hope to see youth helping prepare materials for the elders to make arts and crafts gifts for the new babies.”
The trauma-informed Three Mothers Medicine Camps pilot program is scheduled to begin this fall.
CRIMES PER 100,000 POPULATION IN 2022
6,152
GREATER VICTORIA (VICTORIA CMA) DOWN 12% FROM 2012
8,139 BRITISH COLUMBIA
6,195 CANADA
VIOLENT CRIMES RATE PER 100,000 POPULATION IN 2022
SDG 16
SEXUAL ASSAULT
LEVEL 1, 2 AND 3
SDG 5 SDG 16
YOUTH CRIME
YOUTH CHARGED WITH CRIMINAL VIOLATIONS
1,478
GREATER VICTORIA (VICTORIA CMA) UP 30% FROM 2012
1,533 BRITISH COLUMBIA
1,365 CANADA
RATE PER 100,000 POPULATION IN 2022
106
GREATER VICTORIA (VICTORIA CMA) UP 181% FROM 2012
85 BRITISH COLUMBIA
92 CANADA
RATE PER 100,000 YOUTH (12-17 YEARS) IN 2022
815
GREATER VICTORIA (VICTORIA CMA) DOWN 59% FROM 2012
SOURCE: STATISTICS CANADA
679 BRITISH COLUMBIA
1,178 CANADA
SAFE HOUSES, SUPPORTIVE COMMUNITIES
In 2022, the Inter-Cultural Association (ICA) conducted a small study of help-seeking by immigrant women survivors of domestic violence living in Greater Victoria. It builds on prior research that found most newcomers in the region are not sure where to turn when they need legal help and other community supports (ICA, 2021; Verhage, 2021).
These findings support making diverse cultural and peer communities central to the integration and collaboration underway among the region’s support services for survivors of gender-based violence.
5.2: Eliminate violence against women and girls
SDG 5 SDG 16
CHILD VICTIMS IN GREATER VICTORIA IN 2021
RATE OF CHILD VICTIMS, AGED 11 YEARS AND YOUNGER, OF POLICE-REPORTED FAMILY VIOLENCE, BY SEX OF VICTIM, PER 100,000 POPULATION, 2021
Overall rate of 237 victims per 100,000 population, aged 11 years and younger, down from 2020 (262) and up from 2019 (193), and higher than the rate for BC (227) and lower than the rate for Canada (274) in 2021.
YOUTH VICTIMS IN GREATER VICTORIA IN 2021 59
TOTAL
RATE OF YOUTH VICTIMS, AGED 12-17 YEARS, OF POLICE-REPORTED FAMILY VIOLENCE, BY SEX OF VICTIM, PER 100,000 POPULATION, 2021
SENIOR
61
TOTAL
SOURCE: STATISTICS CANADA
TOTAL
VICTIMS
Overall rate of 354 victims per 100,000 population, aged 12-17 years, up from 2020 (343) and down from 2019 (432), and lower than the rates for BC (428) and Canada (478) in 2021.
30
MALES
RATE OF VICTIMS OF POLICE-REPORTED INTIMATE PARTNER VIOLENCE, BY SEX OF VICTIM, PER 100,000 POPULATION, 2021
Total
SOURCE: STATISTICS CANADA
Overall rate of 274 victims per 100,000 population, up from 2020 (254) and 2019 (247), and lower than the rates for BC (316) and Canada (345) in 2021.
16.1: Reduce all forms of violence and related deaths
INTIMATE PARTNER VIOLENCE SDG 5 SDG 16 Visit to explore more data 27
CITIZEN SURVEY GRADE
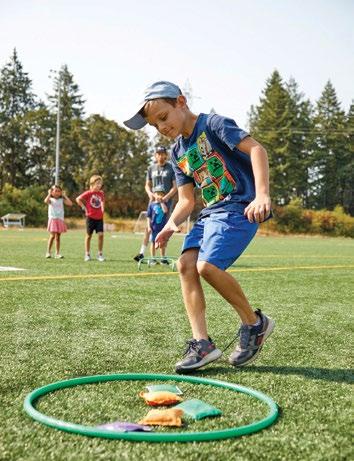
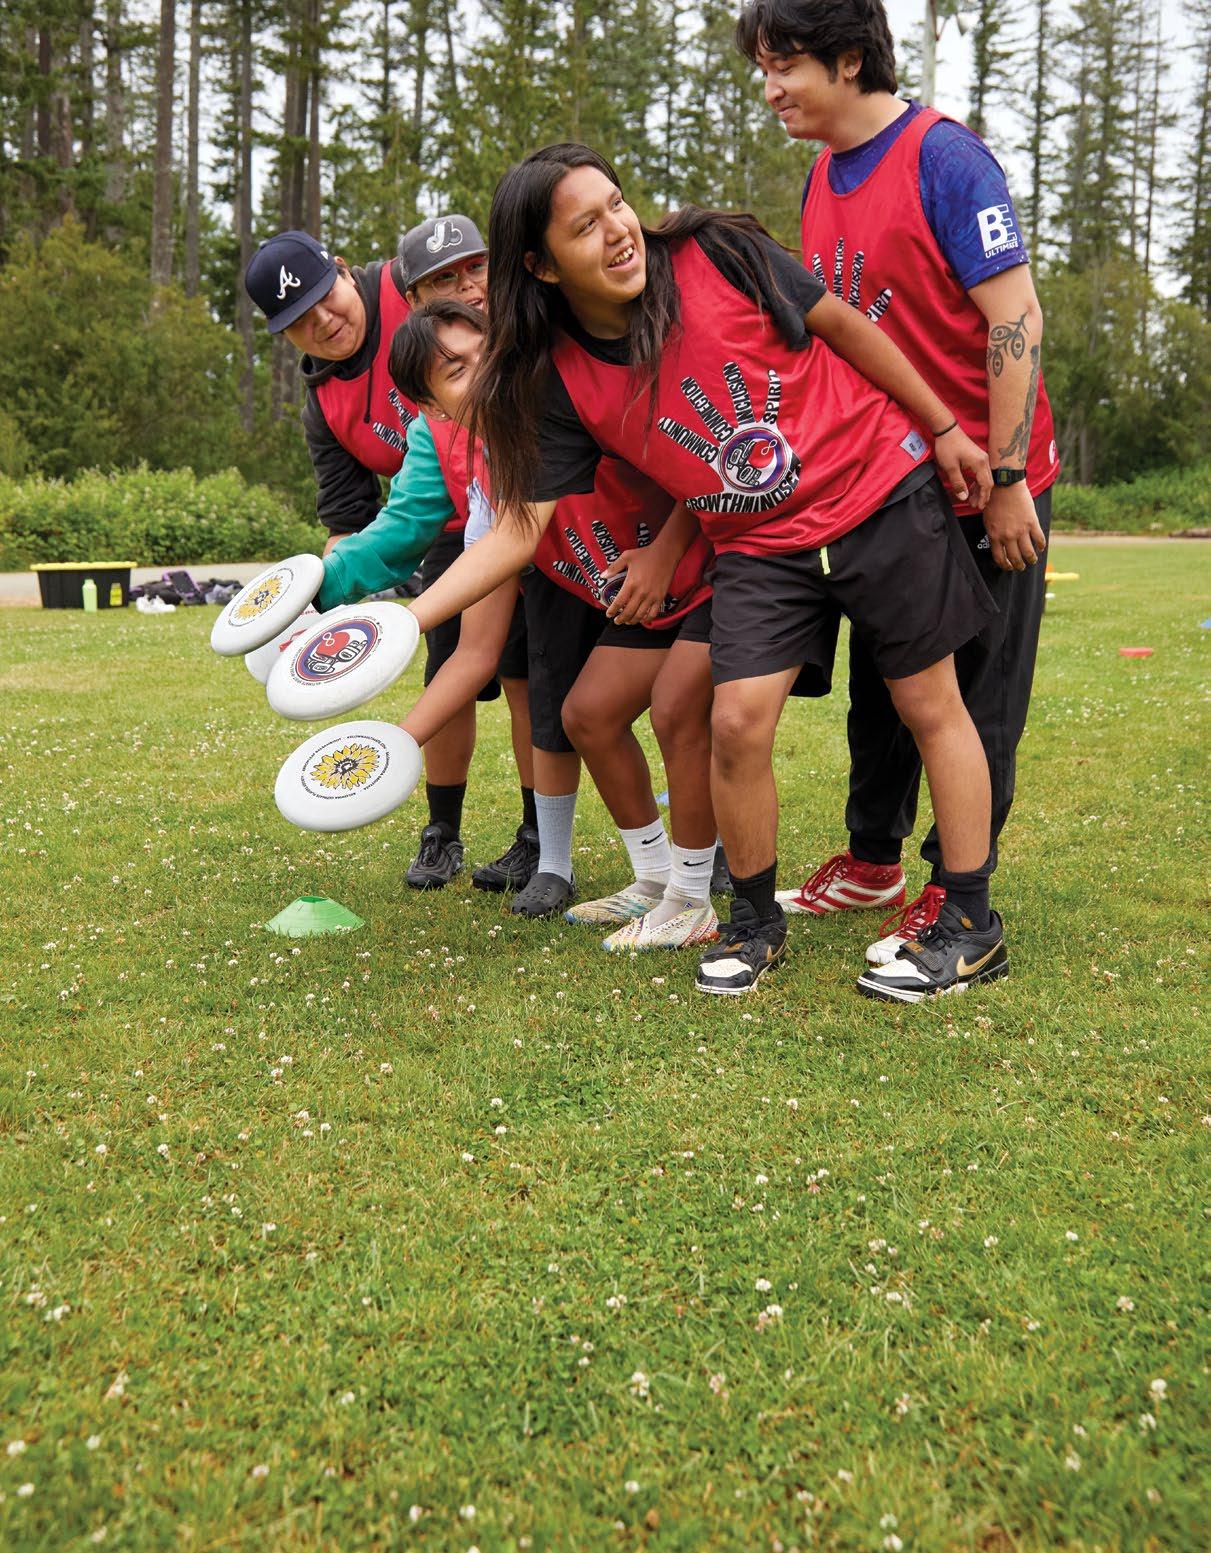
Ultimate Spirit is an ultimate-frisbee-focused program run through the BC Ultimate Society, building transformational connections between Indigenous and non-Indigenous youth in the community. The organization frequently runs afterschool programs through First Nation School Authority schools. Funding through the Victoria Foundation’s Community Grants Program helps unify connection, healing, and wellness in communities through the culture, spirit, and sport of ultimate. In ultimate, there’s no way to score a goal by yourself. You have to rely on your teammates — passing to each other – to reach the goal and find success.
Billy Sampson and Miracle Bartleman shared some of the value created through the games. “At the end of each session, we gather in a Spirit Circle where the youth give each other spirit bracelets. They come in different colours to represent the sport’s physical, mental, emotional, and spiritual aspects. The youths offer them to each other while giving props for a job well done during the session. It’s a great way to remind ourselves that even if we were opponents during the game, we recognize each other’s hard work, sportsmanship, and fair play.”
Sport is an important enabler of sustainable development. We recognize the growing contribution of sport to the realization of development and peace in its promotion of tolerance and respect and the contributions it makes to the empowerment of women and of young people, individuals and communities as well as to health, education and social inclusion objectives.
— DECLARATION OF THE 2030 AGENDA FOR SUSTAINABLE DEVELOPMENT
Since 2021, KidSport Greater Victoria has conducted annual online surveys to understand challenges faced by local families and sport organizations related to the COVID-19 pandemic.
FAMILIES AND KIDS
PARTICIPATION IN SPORT AND PHYSICAL ACTIVITY COMPARED TO 2019 (PRE-PANDEMIC)
35%
ARE MUCH MORE ACTIVE
22%
SOMEWHAT MORE ACTIVE
29% SAME
84% OF CHILDREN AND YOUTH SAID THEY WILL STAY IN SPORT FOR SURE
14% WILL PROBABLY STAY IN SPORT OVER THE NEXT TWO YEARS
TOP BARRIERS TO PARTICIPATING IN SPORT AND PHYSICAL ACTIVITY:
FINANCIAL BARRIERS
YOUTH SPORT IS BOUNCING BACK ACROSS CANADA:
20%
of parents report availability of organized sports has increased up 7% from Dec 2021
19% of parents report their children participating in more sport, up 7% from Dec 2021
44% of parents report their kids enjoying sport more today, up 12% from Dec 2021
Sport organizations predict a shorter path to “normalcy” than feared, with 31% saying it will take over two years to return to a pre-COVID state, down 21% from Dec 2021.
BUT RISING COSTS THREATENING ACCESS TO SPORT:
44% of parents say they cannot afford to register their children for organized sports
58% of parents say that recreational fees are on the rise, up 17% from Dec 2021
81%
of sport programmers say their operational costs have increased
SOURCE: CANADIAN TIRE JUMPSTART CHARITIES
85%
SOURCE: STATISTICS CANADA
In 2021, 85% of Greater Victoria households participated in outdoor activities close to home, down from 89% in 2019. Close to home means within a 10-minute journey of home.
82% BRITISH COLUMBIA
78% CANADA
registration fees (87%), equipment-related costs (50%), and transportation-related costs (40%)
NON-FINANCIAL BARRIERS
limited access to (20%) and limited information about (17%) sport and physical activity programs, clubs and/or classes
TOP BENEFITS FROM PARTICIPATING IN SPORT AND PHYSICAL ACTIVITY:
TOP WAYS TO IMPROVE SPORT AND PHYSICAL ACTIVITY:
Greater diversity among coaches, leaders, and volunteers: 58% of parents and 41% of youth
Willingness to learn about diverse participants’ needs
52% of parents and 38% of youth
Opportunities for participants to become leaders in sport:
56% of youth and 47% of parents
43% of local sports organizations said they would benefit from access to resources and information to expand diversity and inclusion
LOCAL SPORTS ORGANIZATIONS
PARTICIPATION RATES:
Completely recovered or somewhat recovered compared to 2019:
63% with return of elementary school students
57% return of middle school students 53% return of high school students
As participation rebounds, the ability to attract volunteers is a challenge. Facility, operating and program costs have skyrocketed, making it harder to keep registration fees low.
INCOME FROM REGISTRATION FEES COMPARED TO 2019:
SOURCE: KIDSPORT GREATER VICTORIA

CITIZEN SURVEY GRADE
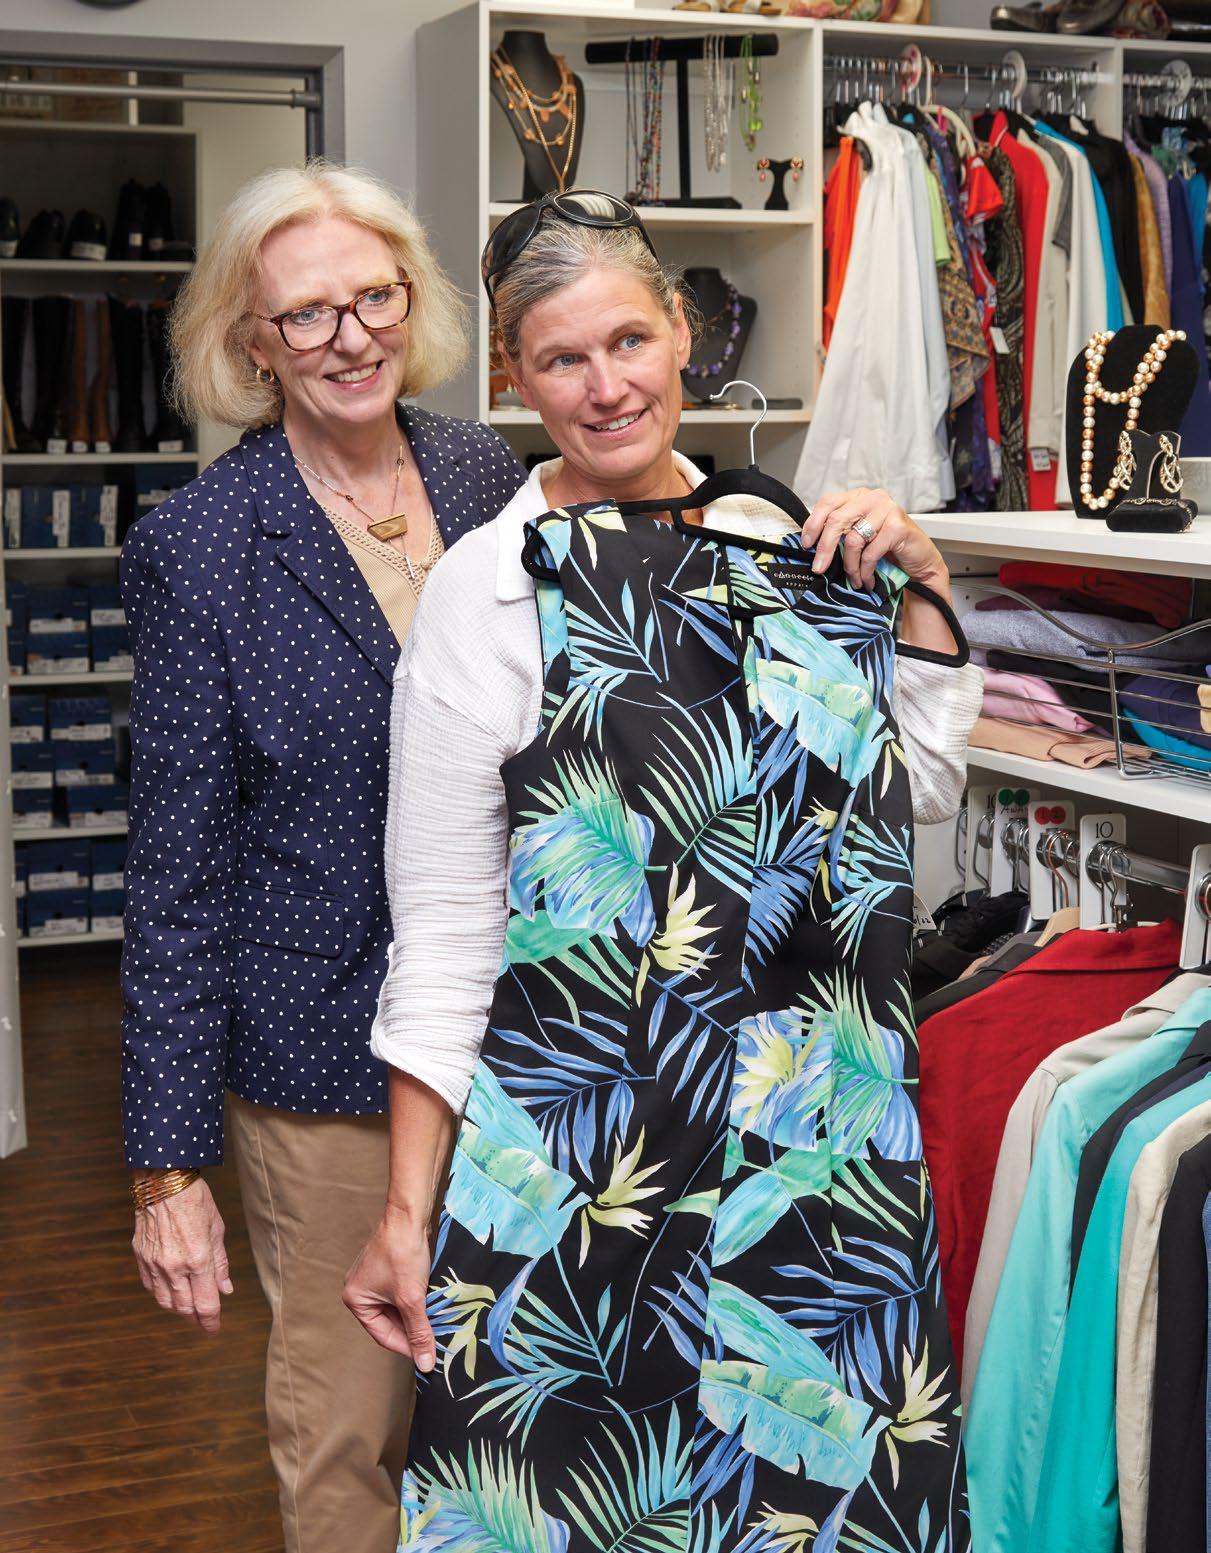
Driven by talented and supportive volunteers, Wear2Start is a registered charity in Victoria providing personalized wardrobe experiences to empower self-identified women to dress their best and build their confidence. The society was founded in 2001 to address a challenge facing many returning to the workforce. People needed funds to buy appropriate clothes for a new job but couldn’t afford a work wardrobe until they had the job. “We’ve broadened our mandate to provide clothing for work and daily life,” said Leelah Dawson, President of Wear2Start. “We receive donated clothing suitable for both, and we recognize that women face a wide range of workplace and living environments, so they need a wide variety of clothing.”
A grant from Victoria Foundation enabled the society to bring on additional staffing support, allowing for continuity and reconnecting with social service agencies after the pandemic. Donors wishing to share up-to-date stylish clothing can make an appointment via the Wear2Start website.
THE POVERTY RATES IN 2021 AS MEASURED BY STATISTICS CANADA’S CENSUS FAMILY LOW INCOME MEASURE AFTER TAX. As of 2020, COVID-19 government income support benefits are included in taxfiler income estimates.
MEDIAN FAMILY AFTER-TAX INCOME IN 2021
$64,980
GREATER VICTORIA UP FROM $63,580 IN 2020
In March 2022, approximately 2,380 food banks provided
TO 1.5 MILLION FOOD BANK USERS ACROSS CANADA,
the highest usage on record. Food bank visits have skyrocketed 35% since 2019.
The top three reasons people accessed a food bank in 2022 were food costs, low provincial social assistance rates, and housing costs. The end of pandemic benefits and significant increases in cost of living have been disastrous for low-income households, with many spending more of their budgets on basic needs, often sacrificing food to pay rent.
In BC, 126 food banks, including four in Greater Victoria, reported 163,200 total visits in 2022, up 25% from 2021 and 31% since 2019. Children under 18 accounted for 32% of visits (52,300). In 2022, BC food banks provided approximately 248,200 meals.
SOURCE: FOOD BANKS CANADA
1.2: Reduce national poverty by 50%
$61,060 BRITISH COLUMBIA
$59,300 CANADA
Note: As of 2020, COVID-19 government income support benefits are included in taxfiler income estimates.
SOURCE: STATISTICS CANADA
MEDIAN INDIVIDUAL TOTAL INCOME IN 2021
$48,050
GREATER VICTORIA UP FROM $46,250 IN 2020
$42,060 BRITISH COLUMBIA
$41,650 CANADA
GREATER VICTORIA IN 2021
$43,100 WOMEN $54,690 MEN
Note: As of 2020, COVID-19 government income support benefits are included in taxfiler income estimates.
SOURCE: STATISTICS CANADA
A FULL-TIME MINIMUM WAGE WORKER EARNS
$16.75/hour = $30,485/year pre-tax
$4,289 above national 2021 poverty line for a single person
$6,562 below national 2021 poverty line for a two-person household if that worker is a single parent of one child
Note: Full-time, full-year work is 35 hours of paid work for 52 weeks. The poverty line is based on Statistics Canada’s 2021 Low Income Measure (LIM) for market income in 2021 constant dollars for a one-person household ($26,196) and a two-person household ($37,047) in Canada.
SOURCE: STATISTICS CANADA
8
$24.29
The hourly wage required to maintain an adequate quality of life in the capital region in 2022. UP FROM $20.46 IN 2021
Food, shelter and childcare continue to make up the largest portion of annual household expenses. The biggest increase was in the cost of food, up 26% compared to 2021.
The Living Wage is the hourly wage that two working parents with two young children must each earn to meet their basic expenses (including rent, child-care, medical needs, food, and transportation), once government taxes, credits, deductions and subsidies have been taken into account.
SOURCE: COMMUNITY SOCIAL PLANNING COUNCIL OF GREATER VICTORIA
End all forms of discrimination against all women and girls everywhere
8.5: Achieve full, productive employment, decent work for all and equal pay for work of equal value


The Investment Readiness Program (IRP) through the Victoria Foundation supports innovative solutions to pressing social, cultural, and environmental challenges across Canada. Capital Bike in Victoria was awarded an IRP grant to scale up its cycling education services. “Over the past twenty years, we’ve been running cycling training courses focused on helping people get ready to ride in an urban environment,” shared Adam Krupper, Executive Director. “These are the basic skills needed to feel confident and safe riding to school, work, or a friend’s house. With IRP, we wanted to build an inspirational brand, so we retained a local marketing company to develop BikeSmart. We hope that the new brand reflects just how fun our cycling training programs are and we also hope to attract more employers to include cycling skills and encouragement in the workplace.”
Capital Bike hosts various bike-centric events and services throughout the year, such as Go By Bike Week, the Commuter Challenge (a bike vs. car race), the Sticker Challenge (region-wide scavenger hunt), event bike valet services, and even themed group rides. “We organize an annual Truth and Reconciliation Day Ride”, said Adam.
“It’s a way for people to express their solidarity and support for First Nations. Last year, we had over 500 people join. Events like these demonstrate how bikes transcend transportation and are tools for positive social change.”
HOW THE EMPLOYED LABOUR FORCE IN THE VICTORIA CMA, AGED 15 YEARS AND OLDER, COMMUTED TO WORK IN 2021
51% of residents in Greater Victoria used local transit in 2022/23, up from 48% the year before.
TWO IN 10 (18%) residents had used local transit in the past 24 hours, down from 20% in 2021/22, while 41% used it more than a month ago, close to the year before.
SOURCE: STATISTICS CANADA
SDG 11
In 2022/23, Greater Victoria residents made an average of 1.2 one-way trips per week, up from 1.0 in 2021/22:
28%
OCCASIONAL RIDERS
10% MEDIUM RIDERS
4% HEAVY RIDERS
9% LIGHT RIDERS
85%
In 2021, 85% of the Greater Victoria population lived within 500 metres walking distance of a transit stop, fourth highest of Canada’s 36 census metropolitan areas after Montreal, Toronto and Winnipeg. down from 90% in 2016
78% BRITISH COLUMBIA 78% CANADA IN 2021
Of the region’s population with convenient access, approximately 63% had after-tax income under $60,000 and 22% had after-tax income of $60,000 and over.
SOURCE: STATISTICS CANADA
In 2022, four of the top 10 crash intersections in the Vancouver Island region were in Greater Victoria. The region includes the Gulf Islands and Powell River:
60 crashes at Douglas St and McKenzie Ave and McKenzie Ave offramp and onramp, Patricia Bay Hwy and Patricia Bay Hwy onramp and turning lane
57 crashes at Patricia Bay Hwy and Sayward Rd and turning lane
53 crashes at Douglas St and Gorge Rd E and Government St and Hillside Ave and turning lane
51 crashes at McKenzie Ave and Quadra St
SOURCE: INSURANCE CORPORATION OF BRITISH COLUMBIA
In 2022/23, households in Greater Victoria owned or leased an average of 1.6 insured motor vehicles, on par with the previous year, and lower than the household average in BC (1.7) in 2022/23.
SOURCE: BC TRANSIT
SUSTAINABLE DEVELOPMENT TARGETS
All types of ridership were generally consistent with 2021/22.
GREATER VICTORIA TRANSIT RIDERS USED TRANSIT IN 2022/23
21% MORE OFTEN, up from 17% the year before.
22% LESS OFTEN, down significantly from 40% the previous year. 57% ABOUT THE SAME, up significantly from 43% in 2021/22.
GREATER VICTORIA TRANSIT RIDERS USAGE IN 2021/22
The top reasons Greater Victoria residents did not use public transit in 2022/23 were: using other types of transportation (64%), not needing the bus (39%), bus taking too long to arrive at destination (19%), and bus frequency not meeting needs (18%)
SOURCE: BC TRANSIT
Public transit is one of the most sustainable and affordable travel options, and BC Transit works hard to be your best transportation solution. We are increasing ridership by making it easier for people to take the bus with our innovative fare system, Umo, that allows riders to choose between the Umo app or a reloadable Umo card. Our electric demo bus is in service in Victoria, ahead of the first 10 electric buses arriving in late 2023. BC Transit is on a path to a fully electric fleet by 2040, making transit an even more environmentally friendly alternative to driving. People travelling between Downtown Victoria and the West Shore are getting there faster with Blink RapidBus line. We thank our customers for their continued support, and we welcome you on board. For more information on the Victoria Regional Transit System, visit bctransit.com/Victoria.
11.2: Provide access to safe, affordable, accessible and sustainable transport systems for all
Victoria Regional Transit CommissionCITIZEN
SURVEY — This year, 5,319 citizens added their voices to Victoria’s Vital Signs by assigning grades and assessing their experience with various facets of life in each of the 12 key issue areas. They were also asked questions about quality of life, and their perceptions and experience with equity and inclusion.
The online survey, conducted by Leger, is based on a “self-selected” respondent population. The survey was open to all interested individuals in Greater Victoria, and survey participants volunteered to take part in the survey. Therefore, the results should be considered as representative of “interested residents of the capital region” and may not be representative of the Greater Victoria population overall. For a total sample of 5,319, at a 95% confidence level, data is accurate +/- 1.33%, 19 times out of 20. Most market research involves much smaller samples of around 4,000 and a margin of error + or – 5%, 19 times out of 20. 402 surveys were completed via a research panel and 4,917 completed the survey via open-link. This year respondents were able to select a short-form or long-form survey, and 4,367 completed the long form of the survey.
An invitation to participate in the open-link survey was promoted through many websites, social media channels, online newsletters, posters, media coverage, and more.
A full report on the results of the survey and its analysis is available on the Foundation’s website. Continuing from the 2021 theme of equity and inclusion, there is a segmentation analysis of BIPOC (Black, Indigenous, and People of Colour) respondents on select questions in the survey results. Best practices for addressing different ethnic groups within the research is still being developed. However, due to the small sample sizes, ethnicities other than Caucasian were aggregated to form the BIPOC category.
To complement citizen opinion data, the Victoria Foundation curates secondary data on a range of indicators from Statistics Canada and other institutional sources. Through our Vital Community Network, we consult local experts from a range of Greater Victoria organizations who help us identify meaningful indicators. Ultimately, the availability and accessibility of reliable data determines if we can report on a given indicator. Sponsors do not influence the indicator data in any way.
A note about geography: Greater Victoria is an umbrella term that applies to different geographical areas, depending on the indicator. It can refer to the capital region, Victoria Census Metropolitan Area or South Vancouver Island Health Service Delivery Area. For a full list of indicators, data sources and geographies used in this report, visit victoriafoundation.ca.
Citizen grading of the issue areas is based on a report card scale:
A Excellent, stay the course
B Good, but improvements could be made
C Average performance, suggest additional effort be made to address these issues
D Below average performance, additional work is required
F Failure, immediate action is required
Transportation includes the ability to get around and transport people and goods. The capacity and convenience of transportation, such as our transit and road systems, have a big impact on quality of life.
Individuals, families, and children living below the poverty line may face many obstacles, which can limit their ability to enjoy quality of life.
Sport and recreation play a foundational role in developing and sustaining healthy citizens and communities.
Public and personal safety affects the way we socialize and participate in community life.
Arts and culture make a community a vibrant and enriching place to live. An active and diverse mix of cultural offerings increases our sense of satisfaction with our environment and community pride.
Participation in civic life contributes to the wellbeing of our community and to our sense of connection to one another. By engaging, we foster leadership that helps build and maintain a vibrant community.

Lifelong learning and educational achievement affect our ability to participate in a competitive workforce, achieve higher incomes, and escape the cycle of poverty.
Having safe and accessible housing people can afford is a basic need that contributes significantly to quality of life.
Strong and vibrant communities have diverse local economies and a wide variety of options for fulfilling, secure, and well-paid work.
From the air we breathe to the ground we walk on, a healthy and sustainable environment is an important part of quality of life. A healthy environment is reflective of a healthy community.
Helping children, youth, and newcomers to get a good start in life, work, adulthood, and our community makes a lasting difference.
Good physical and mental health and wellness improves the quality of individual lives and reduces health care costs. The health status of people depends on good health practices and behaviour, and access to health care services.
THIS REPORT ONLY SCRATCHES THE SURFACE
Want to learn more? Information is available, including details on indicators, sources, and survey results, at victoriafoundation.ca.
TheVictoriaFoundation victoriafoundation
As a member-owned financial cooperative, we’re helping our 600,000 members with their real financial goals and challenges so they can live the life they want. Together, we reinvested $4.7 million into local communities in 2022, with more than $95 million reinvested over the past two decades.

We’re setting the standard for making positive social contributions by integrating our purpose into every dimension of our business.
Learn more at coastcapitalsavings.com/about-us