7 minute read
The need for speed sensors and their diagnosis


SERVICE INFORMATION AND APPROPRIATE TOOLING CREATE THE NECESSARY RESOURCES FOR NON-INVASIVE SPEED/POSITION SENSOR TESTING
When we consider how long speed/position sensors have been around in the automotive industry, we must realise how critical the information is that such elements provide to diagnosticians.
Advertisement
Two of the most common speed sensor designs are Hall effect and variable reluctance sensors (VRS). In this article, we will tackle:
• Theory and practice of both sensor types
• Diagnostic methods that have proven beneficial to both
• Procedural information to enhance diagnostic routines when confronting systems that rely on speed/position sensors.
To start, it is best to describe the hybridised term of speed/position. Speed projects a measurement of distance divided by time. Position describes the location of components to a reference point. Knowing the fundamental relationship between speed and location enhances the chances for technicians to use features embedded in digital storage oscilloscope tech to improve diagnostic methods when addressing concerns that rely on such fundamental principles.
Determining Speed And Position
Variable reluctance sensors (also called analog) use magnetism to generate values that project a decrease or increase in voltage based on the relationship to moving components. These sensors use two wires, rely on a coil of wire, and house a magnet within the sensor.
Using a nearby reluctor wheel (aka tone ring or timing wheel), the VRS generates a near and dense magnetic field, converts the field to voltage, and generates an analog output later converted to digital by a receiving module. Such a design also creates the need to share events that impact sensor output.
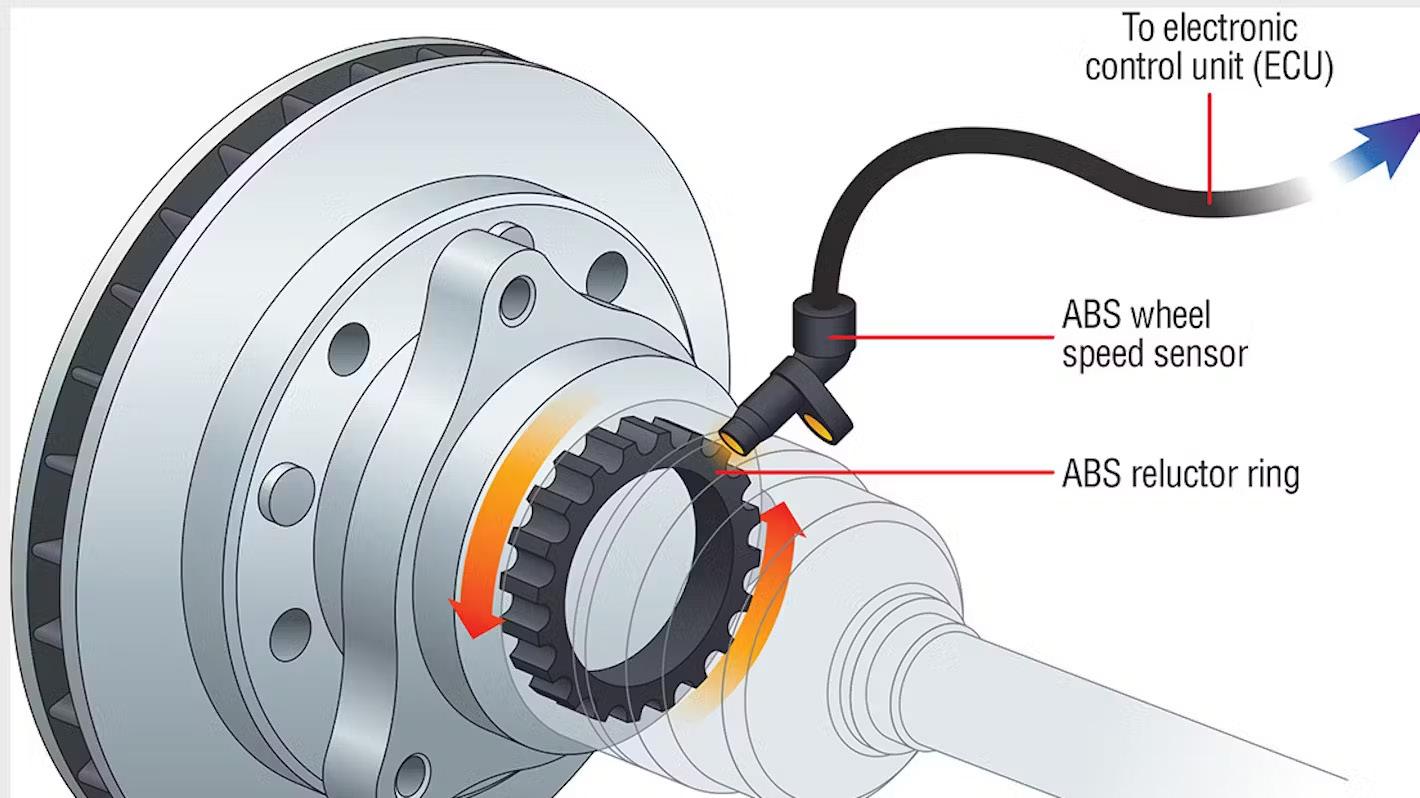
In relationship to a reluctor tine (tooth) on a reluctor wheel, as the tine approaches, the internal magnetism of the VRS will be more centralised on the windings (while getting closer to its housing), therefore creating a rise in voltage output of the sensor (Figure 1)
As the reluctor tine moves away from the sensor element, an inverse reaction takes place, creating a decrease or negative response of energy concentrated within the winding. Due to this notion, the sensor creates a resistive value well within the normalised range of 200-1,000 ohms an analog signal, an AC voltage output. Knowing that this relationship occurs also creates a demand to understand such a sensor’s behaviour based on speed.
VRS do not generate output solely based on proximity but rely on frequency in proximity to a
Similar to VRS, these sensors rely on interactions among static and dynamic components but have the added ability to convert analog values to digital ones. This design is beneficial for two main reasons:
• The sensors do not output a variation of voltage (dependent on time)
• The sensors generate a language (digital) already familiar to receiving modules.
The Hall effect sensor has three wires: power (range up to source voltage), ground, signal (as the sensor provides analog amplification and digital output during the fluctuation of concentrated magnetism).
In the case of a Hall effect sensor, a DMM proves beneficial for measuring power supplied to the sensor, and energy remaining (or consumed) on the ground side of the sensor, but it has limitations in displaying a frequency that could be easily interpreted for diagnostic purposes.
If referencing service information for DTCs, many OEMs may recommend using a DMM to assess a Hall effect CKP’s output. As the sampling abilities of a DMM effect generating 24 digital pulses per revolution, to provide crankshaft speed and position information to the powertrain control module. Its output voltage is stable, typically operating between the reference and source voltage range (~0-12V) rotating component to increase voltage output. Basically, as speed increases, voltage output and frequency increase. Inversely, as speed decreases, voltage output and frequency also decrease (Figure 2). This style of sensor is considered passive.
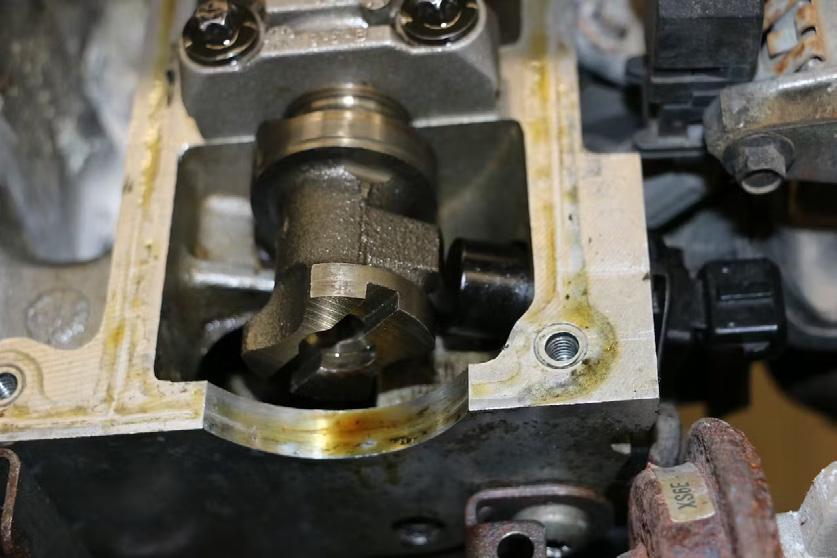
Another idea related to this design is that traditional electrical values may be used to deduce conditions. That value, specifically, is resistance. Manufacturers often provide such resistive values to generate go, no-go specifications for component conductivity (Figure 3)
On the other hand, Hall effect sensors (they internally convert analog values to digital ones) have become a lot more commonplace in the industry.
The Hall effect design is also unique in that its manufacturers do not provide traditional points of measure for static resistive value. A Hall effect sensor is treated as an engineered load requiring power, ground, and a predetermined threshold of voltage output based on proximity to an exciter. This forces the solid-state electronics to generate a traditional digital signal internally (Figure 4)
The only fundamental relationship Hall effect sensors have in common with VRS is frequency. As proximity to a reluctor tine decreases and increases more rapidly, the sensor’s frequency goes up while maintaining consistency in output voltage.
This circuit design is considered superior, as modules are only capable of immediately recognising digital inputs for data (therefore requiring no analog to digital conversion internally) to predict the speed and/ or position.
Testing Sensor Performance
Tools that can be used for testing purposes include an oscilloscope, digital multimeter, and test light. While scan tools can also be used to determine a module’s ability to report and/or receive speed variations, this method requires data to be sent from the sensor to a control module, then reported in a delayed ‘live’ display on a scan tool for interpretation. It is not always an ideal way to approach speed/position sensor component-level testing.
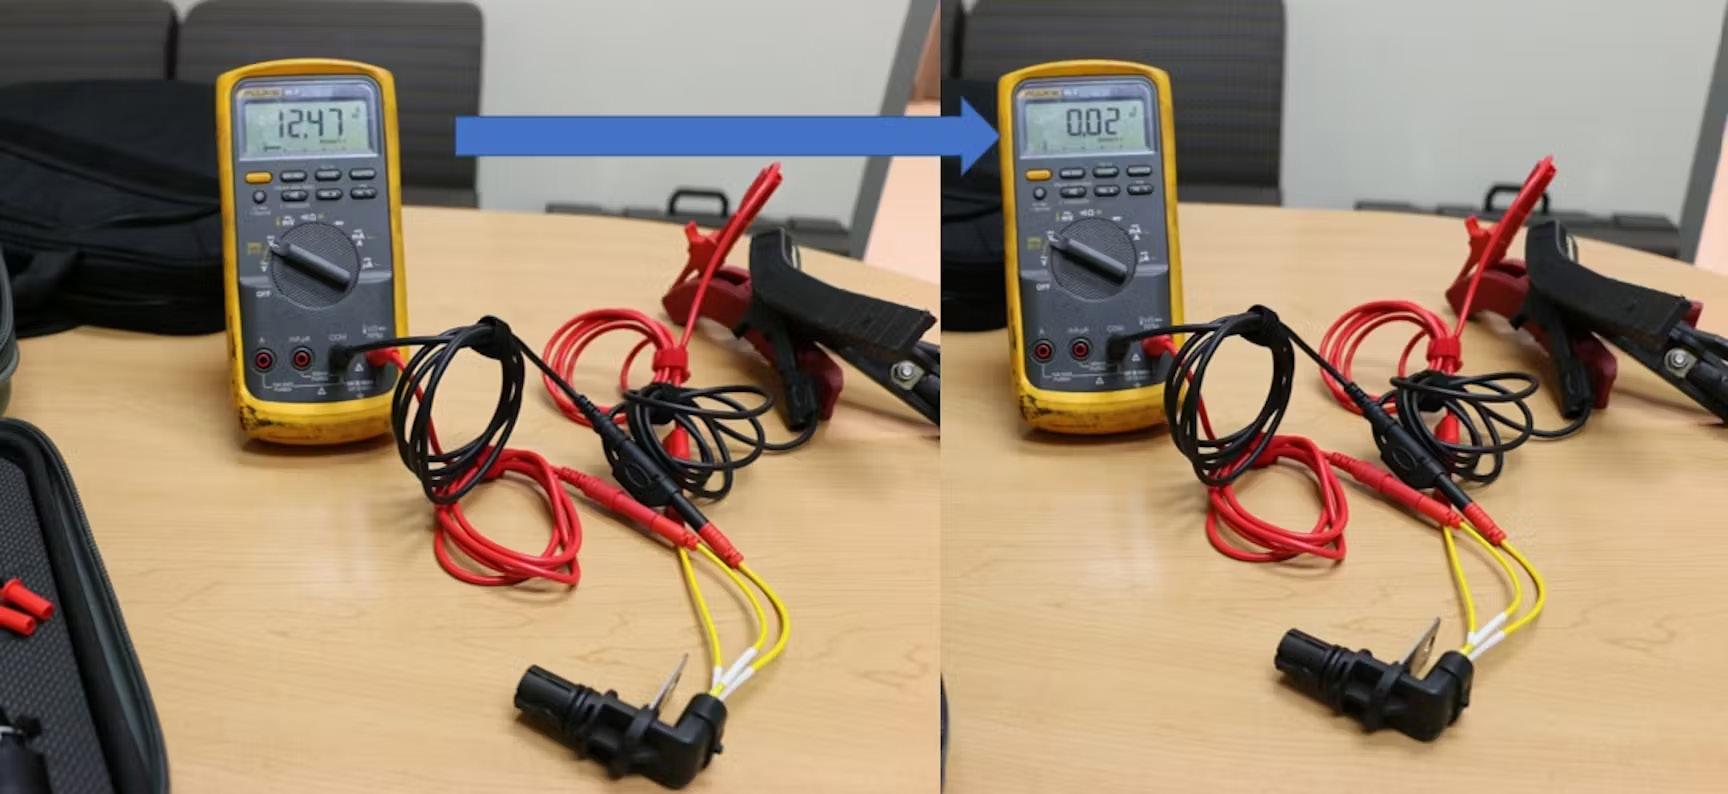
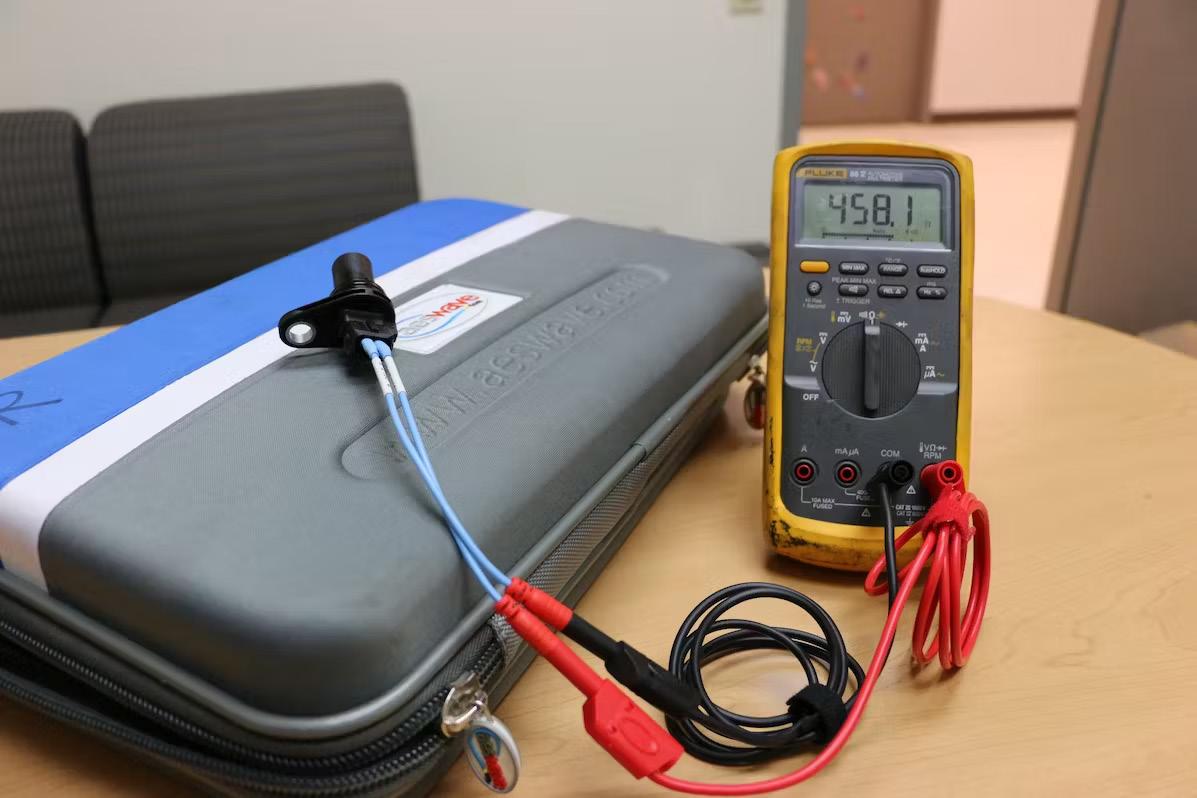
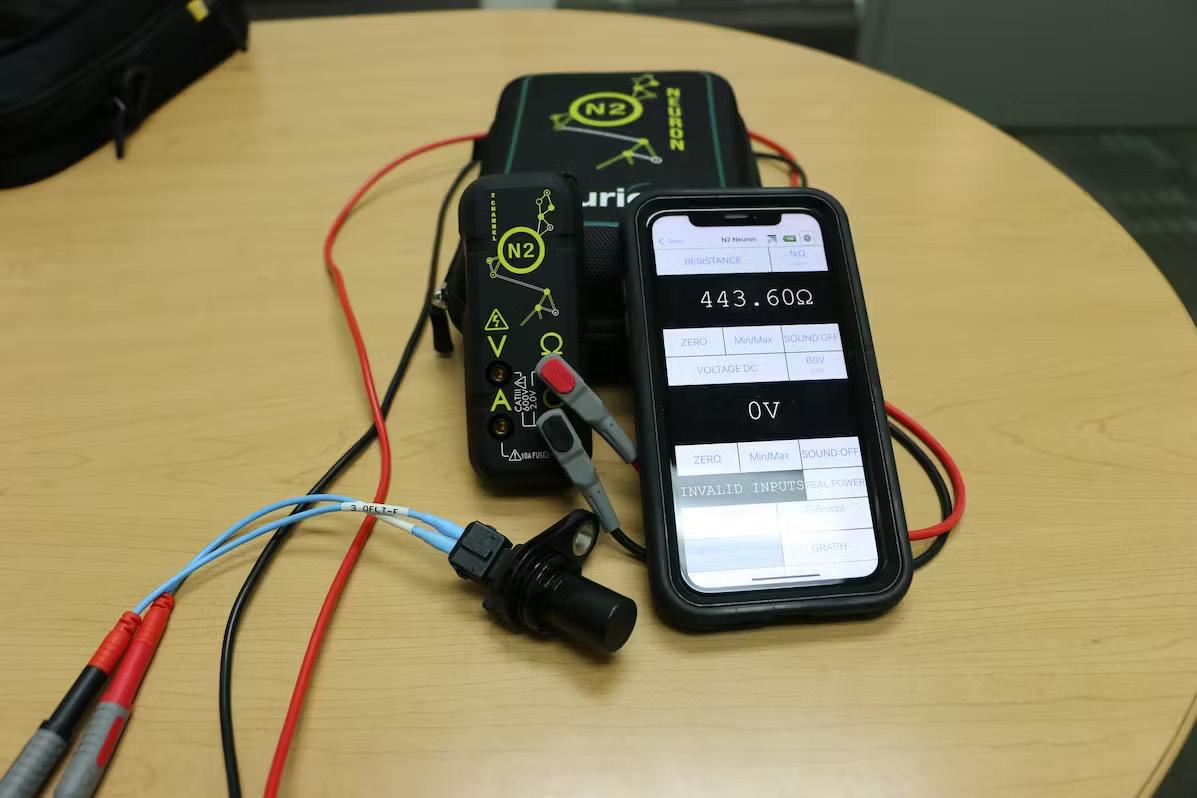
Figure 5 - A Bluetooth- enabled metre capable of measuring voltage, current, and resistance. It also has graphing functions, making measured values easily displayed through a peak of 8,000 Hz sample rate and up to 256 samples in its buffer. Here, it is used to display the static resistance of the variable reluctance camshaft speed/position sensor found in a Ford 2.0L Zetec.
In the context of using a digital multimeter, speed must be considered. DMMs are great for measuring steady variables that commonly include voltage, current, and resistance, but are not ideal for determining rapid peak captures when detecting the amplitude of the signal output of a component with a considerable frequency. In the case of a variable reluctance sensor, a DMM proves valuable for measuring static continuity and dynamic voltage consumption during operation throughout the positive and negative connections within the circuit (Figure 5) are limited, peak and valley voltages are not often readable, therefore showing only an average output.
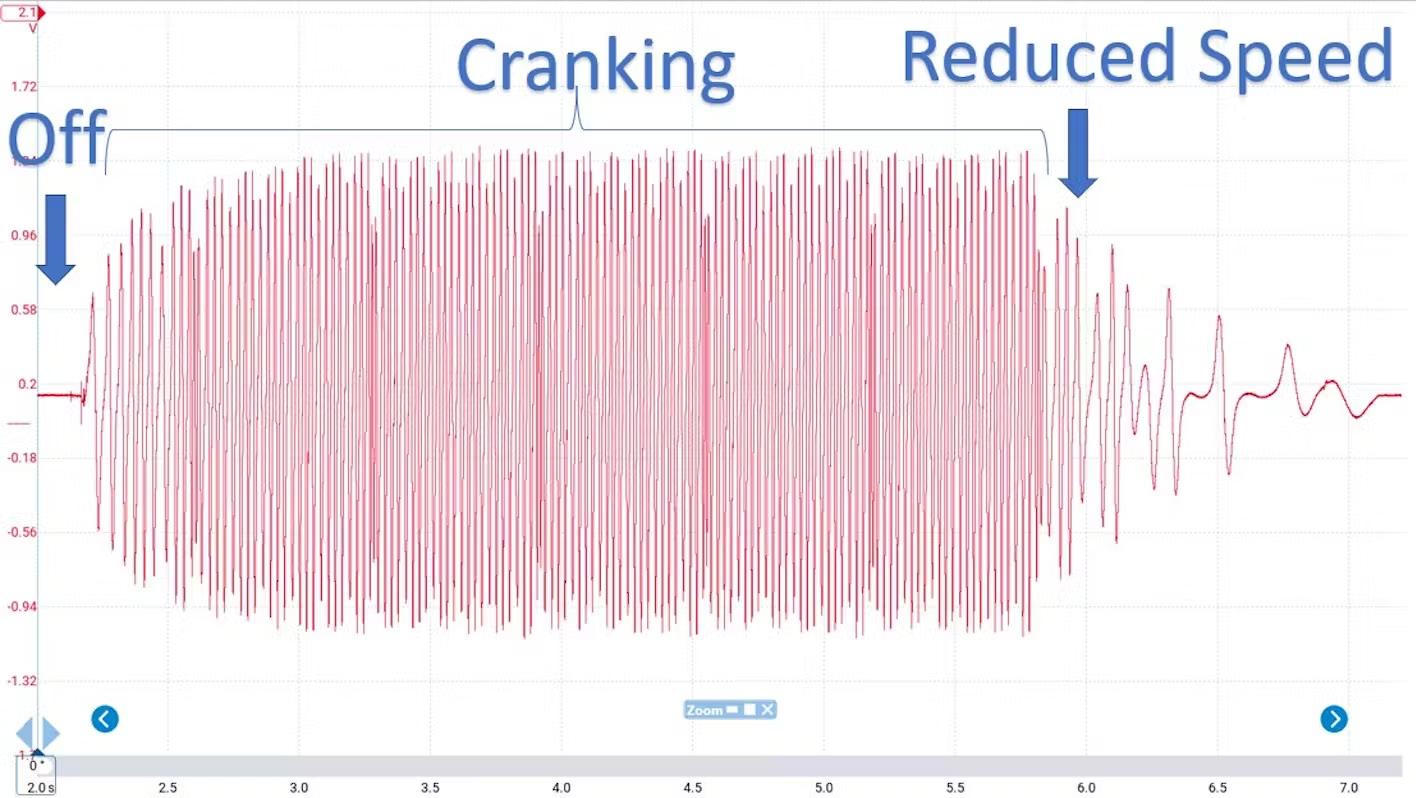
In the Gen 2 LS engine, General Motors specifies a signal voltage output between the range of 4-6 volts when measuring with a DMM actively, though actual voltage output switches from near zero volts to near battery voltage (Figure 6)
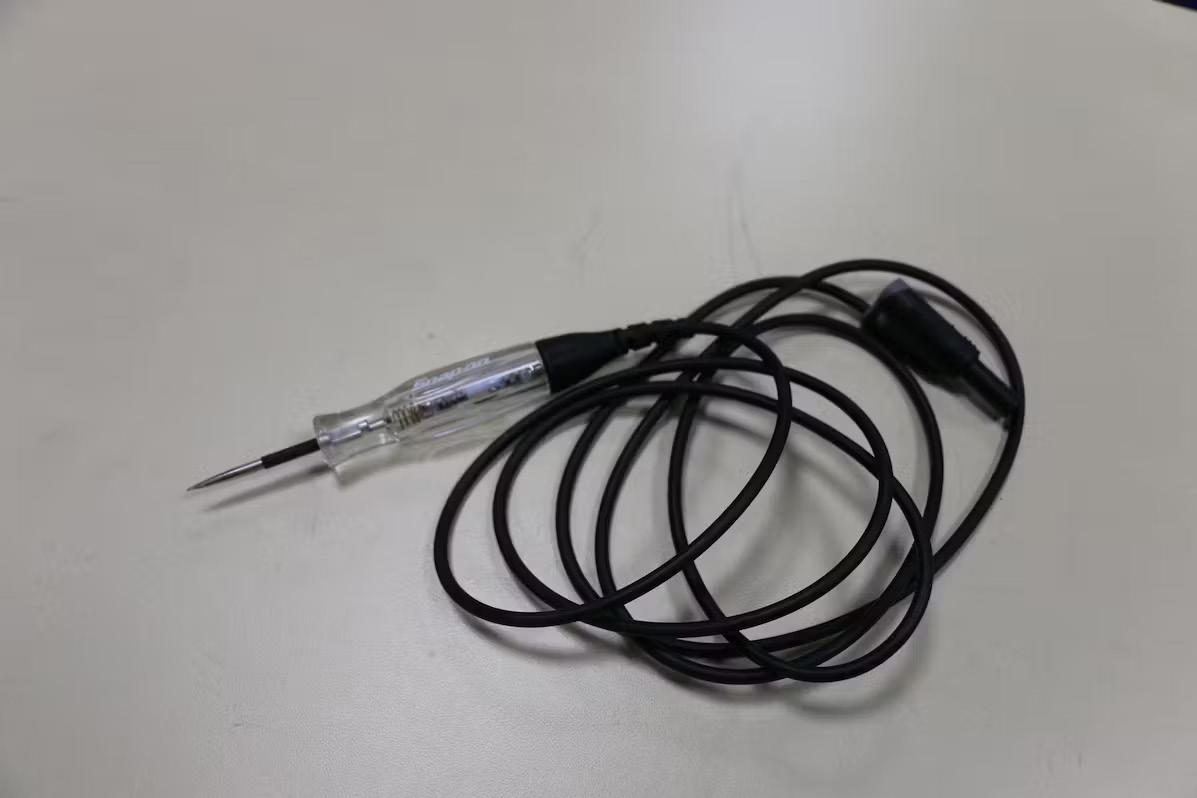
Haakan Light, operator of Shotgun Diagnostics, provided critical feedback for this article’s development. In doing so, he indicated a test light could also be used for diagnostic purposes. While using a controlled engineered load to assess speed/ position sensor circuit functions, one could infer illumination of a test light when checking power availability, pulsation of signal, and energy remaining in a circuit is illustratable with this tool. All would require point for signal measurement (Figure 9)
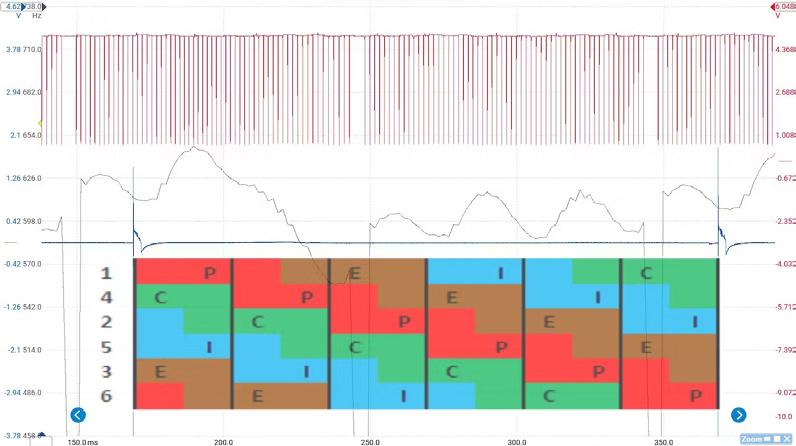
Using service information, he also identified the type of the sensor as Hall effect (since it contained voltage, ground, and signal connections). Service information also provided the theory and operation of this unit, indicating a reluctor wheel tooth count of 58 teeth. For every revolution of the crankshaft, 58 pulses must be displayed followed by two empty high slots of the sensor element. For a complete four-stroke cycle to be witnessed, this rotational event must happen twice.
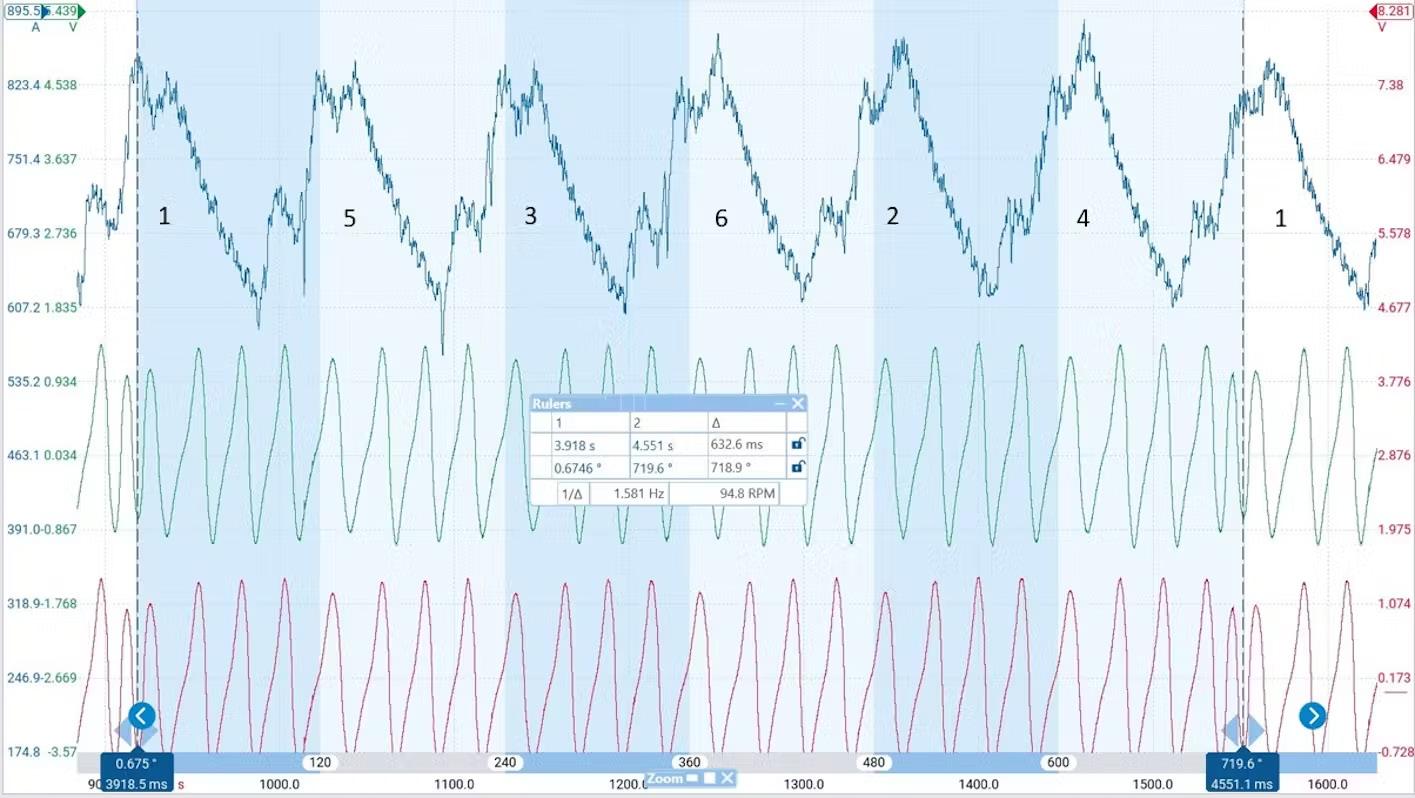
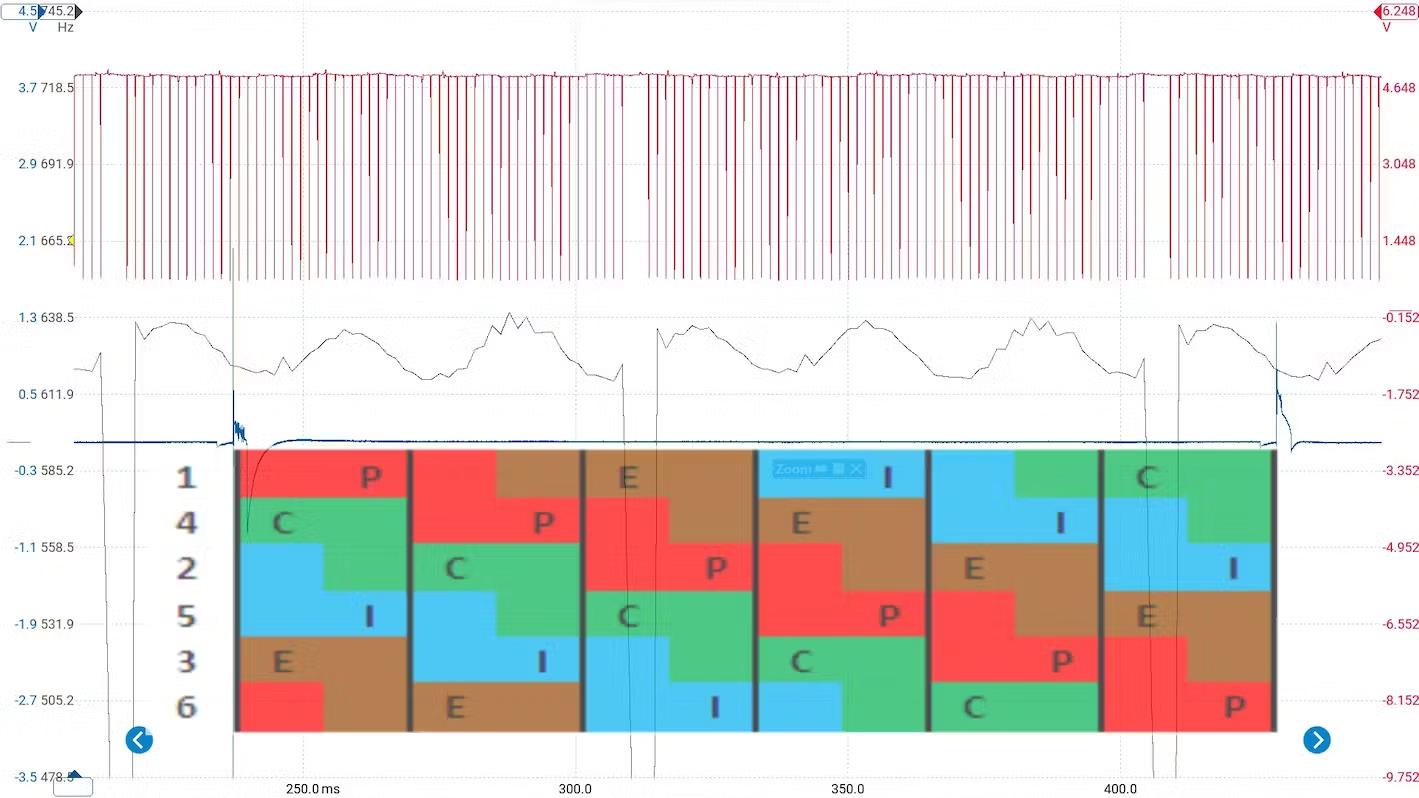
An oscilloscope may also be used to project the power contribution of cylinders in less familiar platforms. Synchronising this event with cylinder 1’s secondary ignition output and converting the frequency of the crankshaft position sensor to a viewable math channel display also provided a broad image of cylinder contribution.
To reference cylinders, the technician used the overlay feature on a ‘piston position charts’ software as an indication of cylinder cycle events. Using this methodology provides a clear and consistent benefit when locating cylinder misfire events that are potentially unreported or misreported (Figures 10+11)
WHAT ABOUT DIESELS?
We explore the relationships of cranking current and cylinder identification on a 2001 Cummins ISM 330-equipped Volvo Day cab. This system uses a variable reluctance camshaft position (titled engine speed) system but maintains two points of input from the sensors:
• One for rpm display
• One for engine control functions.
As measuring compression in this engine may require up to seven hours of book time due to injector removal and installation, DSO could provide imagery to infer engine condition more conveniently. To do so, we located and back-probed the signal wire of the engine speed sensors, connected an amp clamp to the B+ feed on the massive starter to measure current, and manually supplied source voltage to the starter solenoid feed.
The capture indicated 25 pulses from the engine speed sensor per revolution, with two pulses being near one another. We concluded that shorter pulses were used to indicate the location of cylinder number 1’s compression event.
Overlaying the firing order provided sufficient information to conclude each cylinder’s contribution was similar and took less than one second to conclude the engine’s mechanical condition (Figure 12) further pinpoint testing but using such a tool has its place in our diagnostic routine (Figure 7)
To conclude, we’ve explored the basic theory of two common speed sensors, methods for testing statically, and more advanced dynamic methods often critical in the diagnostic process. Diverse methods of assessment can provide accommodation regardless of your inventory.
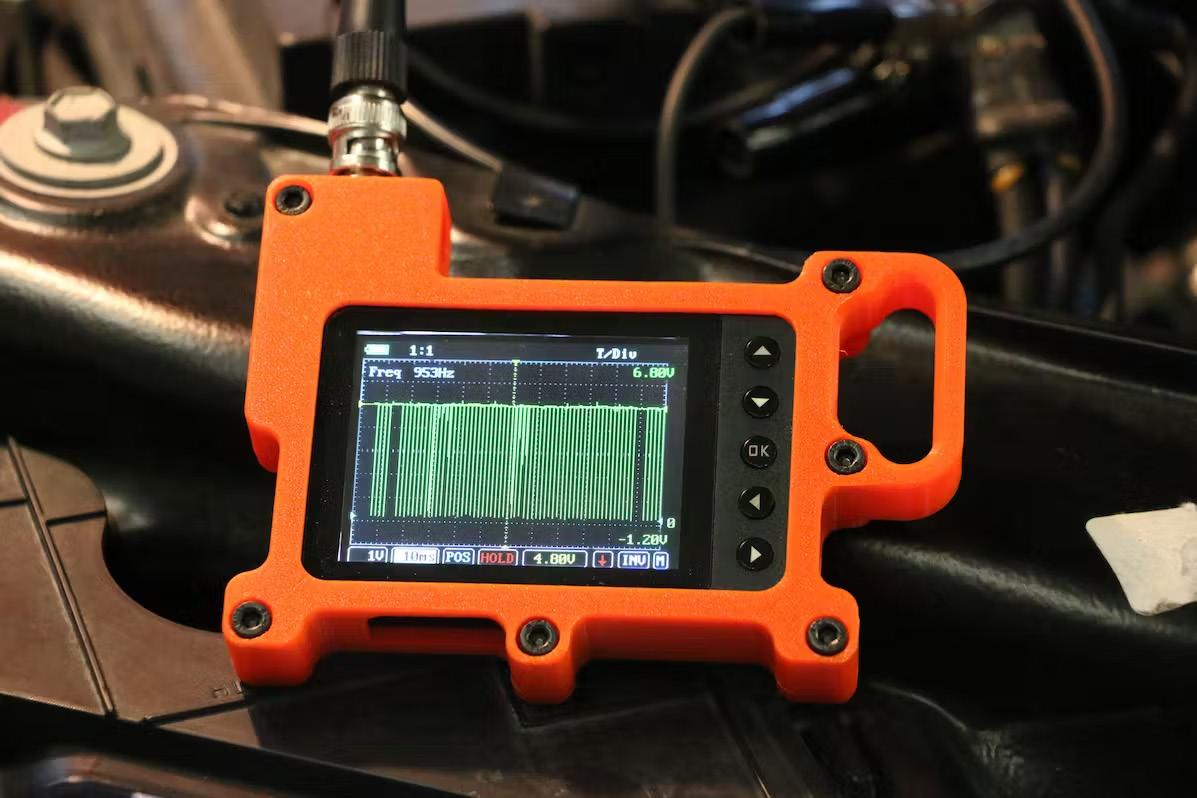
In the case of using a Digital Storage Oscilloscope (DSO) to assess speed/position sensor performance, options are almost limitless. For a quick capture, many technicians typically use a single-channel DSO with a +/-40V (80V total) range. This type of tool also has storage capabilities, a dense array of preset options for component testing, adjustable points of measure, and fits in the palm of your hand. It can display DC voltage inputs for traditional digitised speed/position sensors (Hall effect) and has an AC voltage filter option for VRS. Overall, a DSO is capable of measuring, displaying, and capturing data critical for diagnosing speed/position sensors (Figure 8)
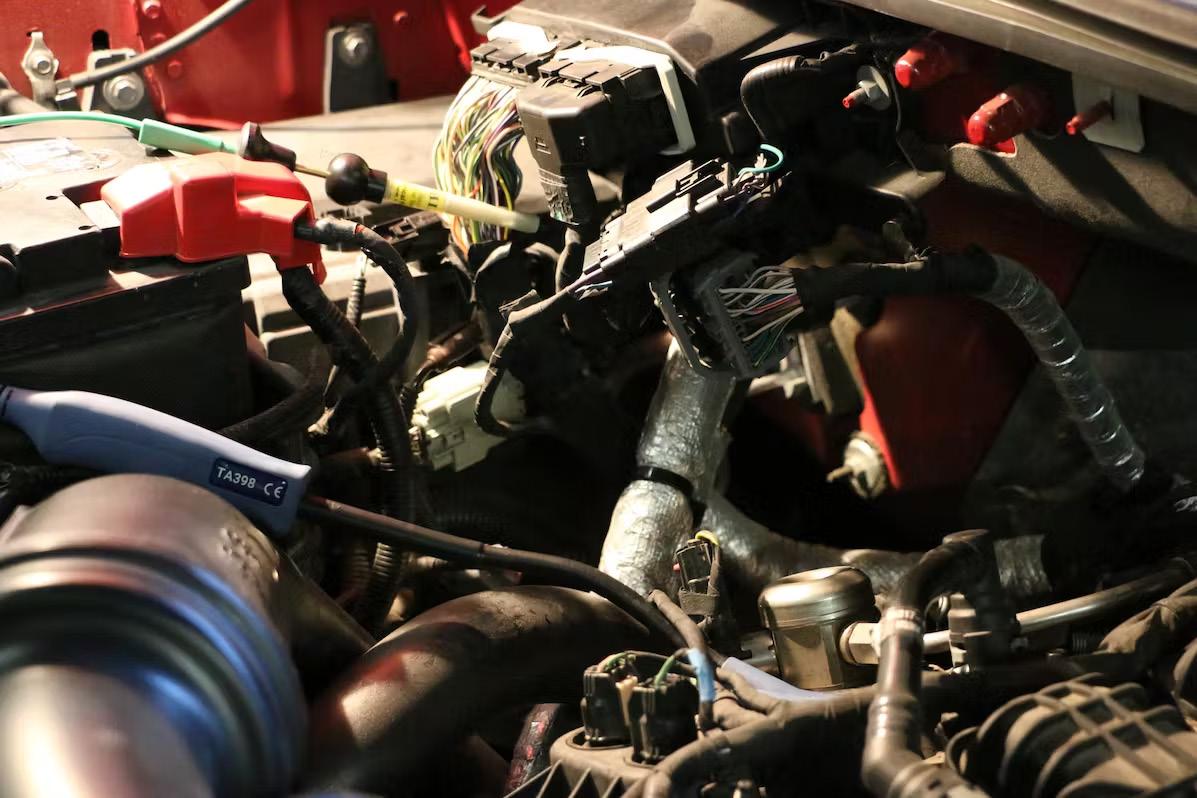
To begin testing any speed/position sensor with a DSO, many rely on OEM or aftermarket diagrams to locate the sensor and access the signal generated by the sensor.
In the case of this 2017 Ford F-150, the crankshaft position sensor was not easily accessible, so the technician decided to use the PCM as the locating


