Global power
c&a
Chart 1. Global electric power consumption, per capita
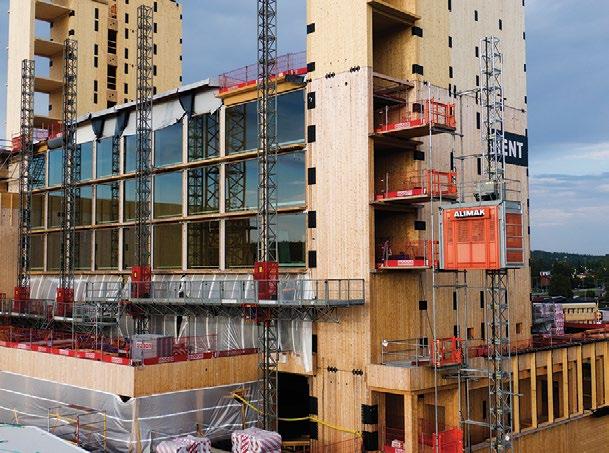
A handful of manufacturers build large components for conventional power plants. Getting them to their destination, often to power hungry and infrastructure poor countries and then installing them on site requires careful planning and clever technological solutions. Will North reports.
In high income countries, where citizens and state benefit from the luxury of readily available low interest investment capital, the desire for a greener future has seen energy derived from fossil fuels gradually fall (see chart 2). In lower income countries where immediate needs are more urgent than long term environmental concerns, electricity generated from these sources has risen from 75 percent to 89 percent.
3250
3000
Mammoet project manager Rutger Beelen says: “Some of the fastest growing economies right now are in sub Saharan Africa, generating greater demand for power there. At the same time Europe is also busy with ‘energy transition’ as conventional power plants are phased out and replaced by more renewable, sustainable power plants.”
Chart 2. Fossil fuels as a percentage of all energy consumption
2500
2014
2013
2012
2011
2010
2009
2008
2007
2006
2005
2004
2003
2002
2001
2250 Year
Source: IEA Statistics, OECD/IEA 2014
2750
2000
No surprise then that low and medium income countries predominate in coal power plant construction. Chart 3, compiled by environmental campaigners Global Energy Monitor, ranks countries by MWh of coal derived electricity coming online between 2017 and the summer of 2020. China leads the field by a long way—although it also leads when it comes to wind and solar power construction. Among the others in the top 10, there are only two highly industrialised nations: Japan and South Korea, while nine of the 10 countries are in Asia, the exception being South Africa.
kWh per capita
Global energy demand continues to soar. As Chart 1 shows, global electric power use per head increased from 2,386kWh to 3,131kWh in the 14 years to 2014. We all use more electricity every day, whether to charge the growing number of electric cars, phones, laptops, and other devices, or because our home has been connected to the grid for the first time, rather than relying on locally sourced fuels like firewood or diesel generators.
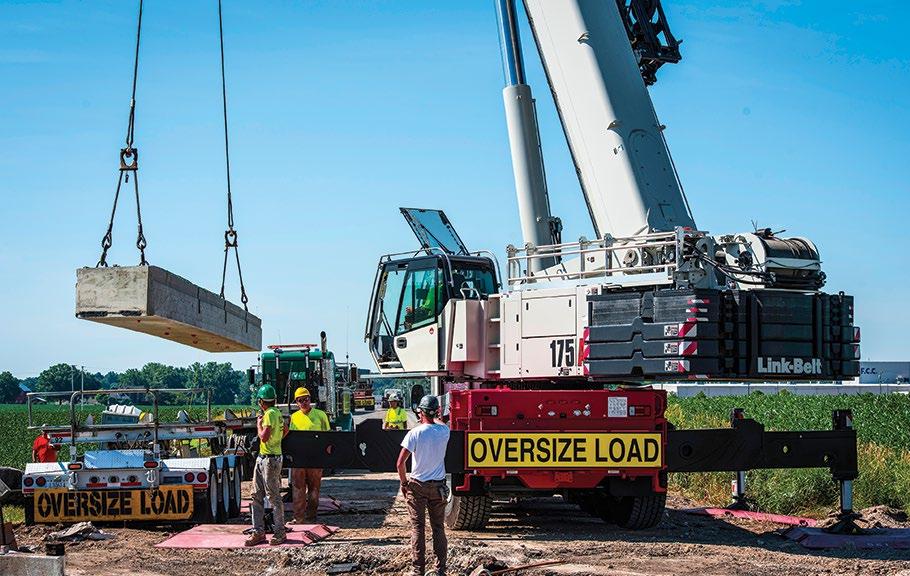
heavy moving
David Allely director of UK transport specialists Allelys group says: “The generators generally weigh around 250 to 300 tonnes, although Siemens’ latest gas turbine–the 8000–weighs 500 tonnes, while Supergrid transformers - used in continental and international transmission networks - weigh up to 200 tonnes and generating transformers up to 350 tonnes.”
Separation of production and use The core components of power plants are not built on site and are mostly fabricated by a handful of companies in the world’s most industrialised countries, manufacturers such as Siemens, Smit, Wartsila, GE and Hitachi, at plants located in Europe, the United States and Japan. Components are shipped as more or less complete units, often weighing hundreds of tonnes with widths of up to seven metres and a height of five metres.
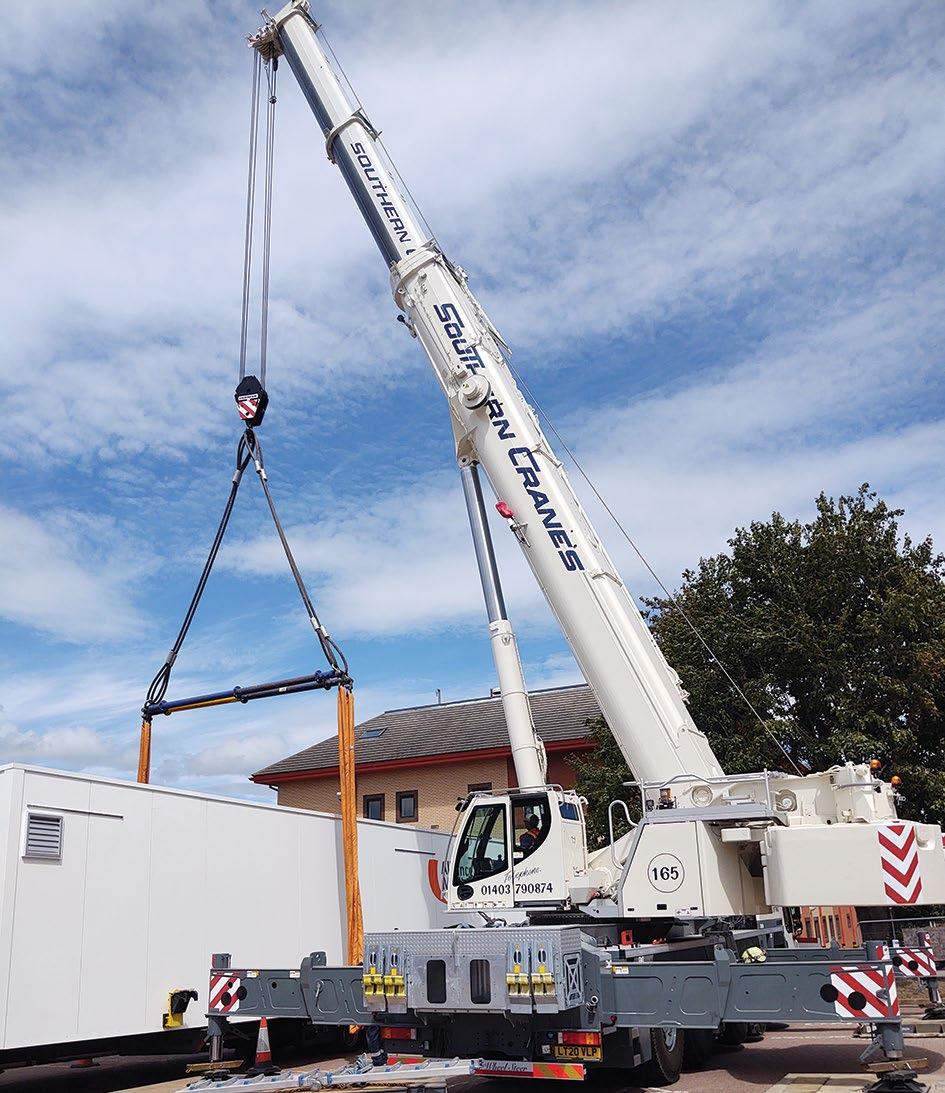
Allely notes that green energy is also employing increasingly large and heavy components. He cites the example of synchronous
Chart 3. New coal power plants, since 2017
90 China India Vietnam
Source: Global Energy Monitor
Japan South Africa Malaysia Taiwan
MWh of new coal power, 2017-2020
100000
High income countries
Pakistan
50000
Year
Low and middle income countries
Indonesia
0
70
Source: IEA Statistics, OECD/IEA 2014
75
Country
South Korea 80
2000 2001 2002 2003 2004 2005 2006 2007 2008 2009 2010 2011 2012 2013 2014 2015
Percentage
85
November 2020 cranes & access
17