10 minute read
WHERE TO GO IN THE LOOMING RECESSION? MADISON SOARING HOUSE PRICES SINCE COVID-19


WHERE TO GO IN THE LOOMING RECESSION? MADISON SOARING HOUSE PRICES SINCE COVID-19
By Ling Lei
Advertisement
BACKGROUND
In 2022, a series of events shook the global economy. The implosion of FTX, the collapse of cryptocurrencies, and a European gas crisis raised concerns about the possibility of a global recession in 2023. Eric Rosengren, the former president of the Boston Federal Reserve, has predicted that a mild recession in the U.S. economy is “quite likely.” (Gilchrist, 2022) During a recession, consumers tend to reduce their spending on non-essential goods, including luxury products and investments such as housing. This may lead to a price collapse for these products.
In fact, the housing market in Madison has entered a downturn recently, as marked by Zillow statistics. After the outbreak of COVID-19, the median listing price for homes in Madison skyrocketed, and this trend continued for more than two years, from 2020 to mid-2022. However, towards the end of 2022, Zillow reported a decline in Madison’s median home value of 6099 dollars, which may indicate the onset of the next recession. The question is: What happened to the surge in Madison’s housing prices during COVID-19, and will the housing bubbles collapse at some point during the impending recession?
SUPPLY AND DEMAND MODEL
In January 2020, officials declared the outbreak of COVID-19. Since then, Madison’s residential real estate market has experienced an unexpected boom. According to Zillow, the typical median home value in Madison increased by a remarkable rate of 33.18%, rising from $279,764 in January 2020 to $372,611 in October 2022 (Zillow). This surge in the residential housing market is due to fundamental forces of supply and demand. On the demand side, COVID-19 has altered home preferences. People tend to focus on the working compatibility of a house instead. During quarantine, restrictions such as city lockdowns and limiting contact have increased people’s anxiety and uncertainty about traditionally-separate work lifestyles. Investigations in Málaga and Poland have confirmed that work preferences have shifted since the outbreak of COVID-19. Instead of prioritizing public transportation when purchasing a home, workers are now evaluating the availability of additional rooms as potential office space. This new trend has remarkably contributed to the stability and growth of the housing market, even during the COVID-19 recession.
On the supply side, the Madison housing market shrank due to infection concerns, uncertainty, and limited new construction. According to the Federal Reserve Bank of St. Louis, the active listing count for houses in Madison has dropped significantly from 1,135 units in Jan 2020 to 410 units in Jan 2022 (ST. LOUIS FED), representing a decrease rate of 63.87%. Infection concerns have impacted suppliers’ decision-making processes. The U.S. Census statistics show that people aged 50 and above are the majority of homeowners in the country, and this group is highly vulnerable to COVID-19 mortality statistics in Wisconsin. As a result, fewer houses have been listed for sale as people are hesitant to risk virus infection by showing their properties to potential buyers. Moreover, the uncertainty of the future has played a critical role in the reduction of supply. According to Benjamin Keys, an economist at the Wharton Business School at the University of Pennsylvania,
“Who wants to sell a house in the middle of a pandemic? That’s what I keep coming back to. Is this a time you want to open your house up to people walking through it? No, of course not.” (Bui and Badger, 2021) Finally, limited new construction in Madison has also contributed to the shrinkage in supply. The City of Madison Planning’s Current Development Proposals show that only 32 townhouses are under construction in 2022, along with 44 units in 2021 (32 single-family houses and 12 townhouses) for sale (City of Madison DPCED Planning). This limited new construction activity has further reduced the supply of houses available in the Madison housing market. Apart from the direct sellers and buyers in the Madison housing market, there is another price variable that comes from visible governmental intervention. In an effort to stimulate the market during the COVID-19 recession, the Federal Reserve lowered interest rates to historical lows and promised to keep rates low for an extended period of time. This has led to a significant decrease in the 30-Year Fixed Rate Mortgage Average in the United States, dropping from 3.51% on Jan 30, 2020, to 2.65% on Jan 7, 2021 (ST.LOUIS FED), the lowest average mortgage rate in 50 years. This has made mortgages more affordable for buyers and has elevated the demand for houses, shifting the demand curve outward. In addition, the White House announced COVID-19 Forbearance and Foreclosure Protections for Homeowners in September 2020 (The White House, 2021), which was extended on Feb 16, 2021. This mortgage relief policy has prevented banks from repossessing properties and putting them up for public auction, thus reducing the supply of houses available for sale and leading the supply curve to shift inward. The government interventions in response to the COVID-19 pandemic have contributed to a rise in house prices, as the increase in demand coupled with the decrease in supply caused by these interventions has driven up prices in the Madison housing market.
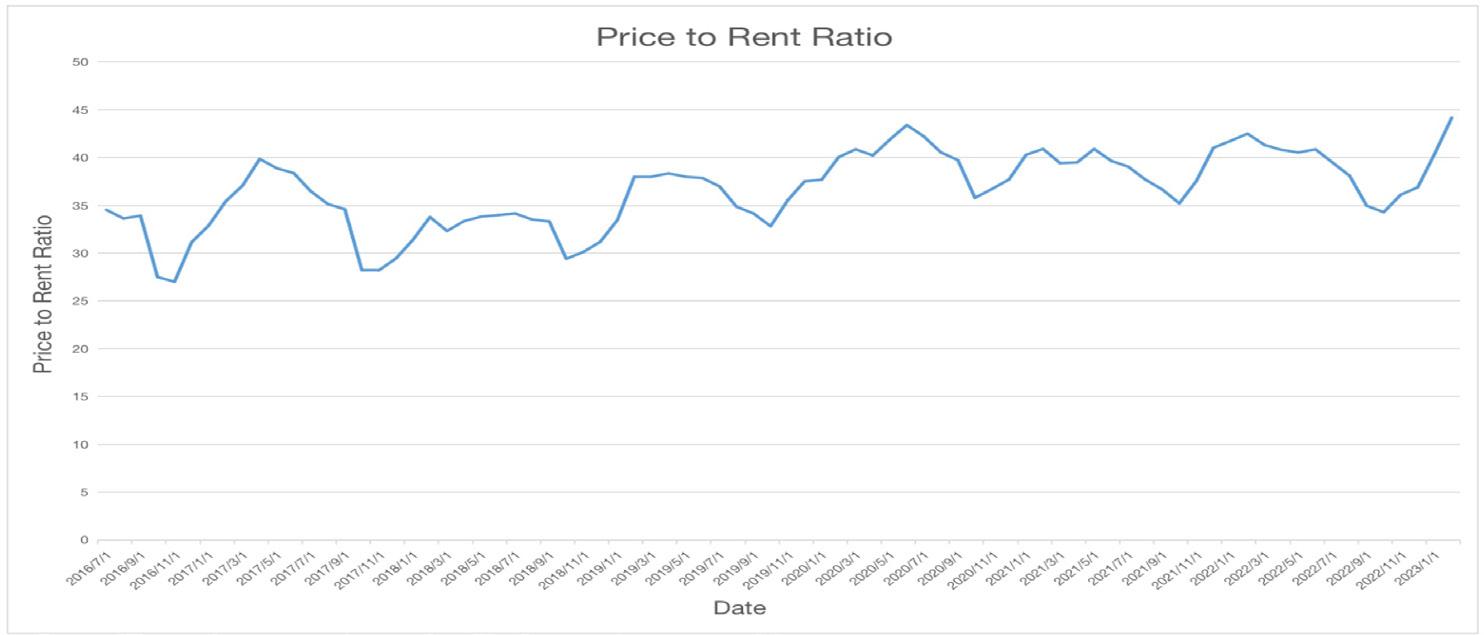
Figure 1. Price to Rent Ratio from 2016 to 2023.

Figure 2. Price to Income Ratio from 2016 to 2021.
FUTURE EXPECTATION
The impending recession raises questions about the future of housing prices in Madison. Will the housing market bubble collapse? Looking back at the 2008 financial crisis and the bursting of the real estate bubble, we will analyze the three main indicators: priceto-rent ratio, price-to-income ratio, andmortgage rate, as discussed in the work of Diamando Afxentiou, Peter Harris, and Paul Kutasovic (2022), to better depict the current situation of the Madison housing market. The first potential indicator of a housing market bubble is the price-to-rent ratio, which is calculated as the median home value divided by the median annual contract rent. This metric is used as a benchmark for estimating whether it’s cheaper to buy or rent a property. Trulia, an American online real estate marketplace, which is a subsidiary of Zillow, sets the thresholds as follows: a price-torent ratio of 1 to 15 indicates that buying is more favorable, a ratio of 16 to 20 indicates that renting is typically more favorable, and a ratio of 21 or more indicates that renting is much more favorable (Trulia). In this analysis, median home value comes from Federal Reserve Economic Data, an online database source created and maintained by the Research Department at the Federal Reserve Bank of St. Louis, while median annual contract rents are acquired from Zumper, a rental agent company that records each listing accurately. Rental properties can be simply divided into five major categories in Madison: studio, one bedroom, two bedrooms, three bedrooms, and four bedrooms. For each category, there are different rent distributions and fluctuations. Since we view the rental market as a whole, each category has been weighted by the number of bedrooms it includes, and then used to calculate the average rental price and priceto-rent ratio. The graph displays an intriguing seasonally cyclical upturn, with all price-to-rent ratios exceeding the threshold of 21 set by Trulia. In September of each year, the price-to-rent ratio trend still hints at overvaluation in the housing market.
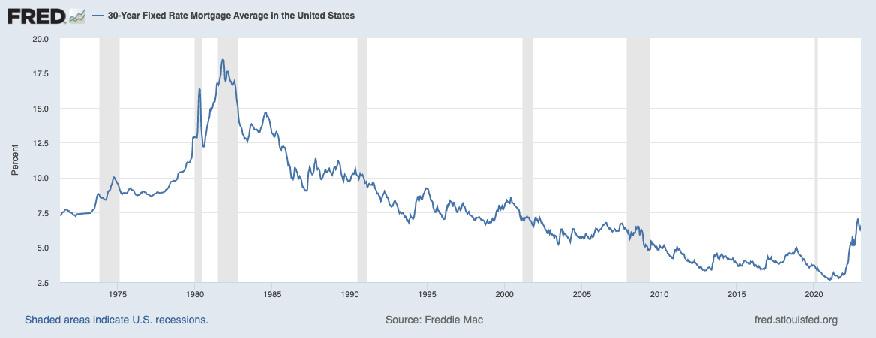
Figure 3. The Average 30-year Fixed Mortgage Rate in the United States.
The graph shows a relatively consistent upward trend in priceto-income ratio, which reached its peak of 4.95 in January 2020 and has remained at this level since then. This upward movement continued even before the COVID-19 pandemic, indicating the likely unaffordability of house prices in Madison, and a turning point appeared in 2019, creating a significant break. However, it is possible that the impact of the COVID-19 pandemic may worsen the situation and cause the price-to-income ratio to reach its highest point in the last six years, making housing even more unaffordable.
The third indicator is the mortgage rate. To combat severe inflation, the Federal Reserve sticks to the hawkish monetary strategy of elevated interest rates, which has resulted in higher mortgage rates in recent years. However, the 30year fixed rate mortgage average in the United States is still relatively low compared to historical levels in the 1900s (ST. LOUIS FRED), as shown in the graph. The rising mortgage rate may help cool down the housing market in a moderate way, but the situation caused by supply and demand fundamentals cannot be solved completely by this secondary tool.
CONCLUSION AND DISCUSSION
After the outbreak of COVID-19, both supply and demand shifts forced Madison home prices upward. On the supply side, infection concerns, future uncertainty, and limited new construction restrain house listing numbers, while people’s preference for altering houses into workplaces affirms the solid boosting needs during the COVID recession on the demand side. As a result, reduced supply and increased demand forced housing prices to skyscraper levels.
During the 2008-2009 housing crash, economists learned that three potential indicators could forecast a housing bubble burst: the price-to-rent ratio, which helps determine whether it’s better to buy or rent; the price-to-in- come ratio, which measures affordability; and mortgage rates, which can dampen buying enthusiasm when they are high. Through investigation of the price-to-rent and price-to-income ratios, it is found that when these two indicators continue to rise, they may be flashing a warning sign. However, the impact of rising mortgage rates can offset this warning to some extent. Therefore, we expect only a slight change in Madison’s local housing market– even during a recession. Moreover, the cyclical pattern of the price-to-rent ratio suggests that the school population may have omitted impacts on the market. There is little research on how they get involved in the housing market. Further research is needed to investigate the potential roles of these players and their participation in the context under study.
REFERENCES
Afxentiou, D., Harris, P., and Kutasovic, P. “The COVID-19 Housing Boom: Is a 2007–2009-Type Crisis on the Horizon?” Journal of Risk and Financial Management 15, no. 8 (2022): 371.
Bui, Q., and E. Badger. “Where Have All the Houses Gone?” The New York Times, October 22, 2021. City of Madison DPCED Planning. “817 Big Stone Trail-Planning -DPCED.”
City of Madison, n.d. Zumper. “Average Rent in Madison, WI and Cost Information.” Accessed March 8, 2023.
Divounguy, O. “Declining Demand Drives Price Pullback.” Zillow, October 12, 2022.
Gilchrist, K. “U.S. likely headed for mild recession in 2023: Eric Rosengren.” CNBC, November 8, 2022.
Kocur-Bera, K. “Impact of the COVID-19 Pandemic Era on Residential Property Features: Pilot Studies in Poland.” International Journal of Environmental Research and Public Health 19, no. 9 (2022).
Rosa-Jiménez, C., and C. Jaime-Segura. “Living Space Needs of Small Housing in the Post-Pandemic Era: Malaga as a case study.” Journal of Contemporary Urban Af airs 6 (2022): 51-58.
ST. LOUIS FED. “Housing Inventory: Active Listing Count in Madison, WI (CBSA).” FRED, n.d.
ST. LOUIS FED. “30-Year Fixed Rate Mortgage Average in the United States.” FRED, n.d. Trulia. “Trulia.com Introduces Rent vs. Buy Index.” Trulia, n.d.
The White House. “Fact Sheet: Biden Administration Announces Extension of COVID-19 Forbearance and Foreclosure Protections for Homeowners.” 2021.