Economic Theory


Real Estate and Land
Political Economy
Labor and Health
Econ PhD Application Tips
THE EDITION
uilibrium INSIDE
UW–MADISON’S UNDERGRADUATE JOURNAL OF ECONOMICS SPRING 2023 VOLUME 13

Economic Theory
Real Estate and Land
Political Economy
Labor and Health
Econ PhD Application Tips
Founded in 2010 and first published in 2011, Equilibrium is the rigorous Undergraduate Journal of Economics at the University of Wisconsin–Madison. Our mission is to showcase the excellent research undertaken by undergraduates in the economics department and to convey economic literature to wider audiences. EQ Journal publishes articles on an annual basis in Spring. Each Equilibrium volume includes articles written and edited by undergraduates about analysis-based articles, research reviews, opinion pieces on trending topics in economics, and faculty interviews with department members. Copies of previous EQ editions can be found at the Undergraduate Economics Office (7238 Social Sciences), and digital issues are accessible for download on this website: equilibriumecon.wisc.edu


The contributors to Equilibrium and the Department of Economics, University of Wisconsin-Madison, are proud to present the thirteenth edition of Equilibrium: The Undergraduate Journal of Economics. Our goal is to highlight the outstanding research that our economics undergraduates have done, particularly that of our contributing writers.
With this thirteenth edition, we are excited to share a diverse profile of writers who have contributed insightful articles on a wide range of topics. For instance, writers interested in real estate delve into zoning regulations and corresponding housing affordability in Madison. On the topic of political economics, writers examine the lingering effects of divided government in the US and the Russia-Ukraine War on the world economy. Our labor and health writers explore healthcare policy, Chinese population issues, and analyze urban crime rates and income inequality. Additionally, some articles cover general economic theory, such as asymmetry in higher education ranking, market mechanisms for job matching, paperless ticketing, luxury goods in networks, and the AI impacts of the financial industry. We hope that you will gain fresh perspectives from all of these fields of interest that our talented writers have contributed to.
We are indebted to our Journal Advisor Tara Ninmann for general guidance and support in publication, Design Partner Amy Schultz for accommodating
EQ to partner with a UW Digital Studies program, and two graphic designers, Lauren Hando and Jamie Randall. We would also like to thank WIDE (PhD cohorts) for helpful suggestions for economics explorations, and we are grateful to faculty members for generously supporting the review process. We appreciate the work our department has done to support funding, get more UGRD students involved in research, and start more conversations to make the department more open to everyone.
Finally, we appreciate all the great work from all our contributing writers. Creating the Equilibrium journal is a collaborative effort, and it would not have been possible without your dedicated input. Research is a long-term commitment, and we hope this unique experience of conducting economics research, intensive writing, and publishing, will inspire you on whatever your next journey through life may be!
Sincerely,


The rise of technology has brought about many changes in the way we conduct our daily lives. One area that has seen significant change is the ticketing industry. Paperless ticketing refers to the process of using digital tickets instead of physical ones. While paperless ticketing has been widely used in the airline and hotel industries, the live entertainment sector has just recently adopted this ticketing system. In late 2009, paperless ticketing accounted for less than one percent of all concert ticket sales(Rascher & Schwarzt, 2013). In recent years, this method of ticketing has become increasingly popular, with companies such as Ticketmaster leading the way. However, the adoption of paperless ticketing has had a number of implications for both the primary and secondary ticket markets.
The primary market refers to the initial sale of tickets to an event. In the past, primary market tickets were sold through physical outlets such as box offices and ticket outlets. With the introduction of paperless ticketing, primary market ticket sales have largely moved online. Reducing the paper associated with printing and ship-
ping tickets has had many positive effects on the environment as it reduces waste and costs. Additionally, paperless ticketing can reduce the number of fraudulent tickets in circulation as tickets are tied to specific individuals and cannot be easily duplicated. The primary ticket market therefore becomes efficient and prevailing. When buying paperless tickets on the primary market, the sellers also have more power in being able to limit the resale of their event tickets and ensure profits. While there are benefits to allowing artists to have market power in resales, paperless ticketing sites also lock consumers into only reselling within their sites. This reduces consumer welfare by limiting how resources are efficiently allocated.
One such paperless ticket reseller that distributes within the primary and secondary markets is Ticketmaster. With the rise of paperless ticketing, Ticketmaster has become a dominant player in the market and is one of the largest ticket sellers in the world. The degree of Ticketmaster’s power in this market can be seen through their vast
analysis, 2010). Their monopoly shares a portion of their ticket sale fees with producers, artists, and managers, and in return, they have long term contracts with these venues where they can only have primary market tickets sold by Ticketmaster. Upon purchasing a paperless ticket, a consumer is charged the face value of a ticket and an additional service charge. The service charge is made up of a convenience fee, an order-processing fee, a facility fee, and a “ticketfast” fee (delivery method to skip mail delivery as well as priority entrance at venue gates). Ticketmaster gets 40% of the service charge fees while the venue gets 60% of the fees(Knopper, 2009, figure 1).
When purchasing a paperless ticket, card identification that links to personal information and other technological restrictions make it hard to transfer tickets. Unless specifically mentioned, “resale of tickets” is severely restricted with TicketMaster. If resale in the secondary market is an option, it has to be done through Ticketmaster’s daughter company,
BY MEGHNA KRISHNAary markets increase welfare, increase producer surplus, and keep consumer surplus no worse off as Pareto improvement(Spindler, 2003). Also, standard economics predicts that societal efficiency is maximized when markets allow goods to be reallocated to those with the highest willingness to pay. When states permit this, the quantity of tickets supplied has grown and prices have not changed much. David Harrington shows that in NHL cities where resale laws were repealed, the quantity of tickets supplied in the secondary market rose substantially, while the price, which fluctuated, was generally steady over time(Harrington, 2010).
share of venues in comparison to other paperless ticketing sites.
In 2008, Ticketmaster had almost 83 percent share of venues(DOJ
As venues receive more than half of the service fees, they are enticed to sign these contracts with Ticketmaster. The face value of the tickets is determined by the venues and artists. While Ticketmaster doesn’t directly set the original ticket prices, their ability to guide a marked-up service fees helps them act more like one. This monopoly power allows Ticketmaster to charge ticket fees as high as 47 percent of the face value of the tickets(Pickert, 2009). This growth rate of ticket prices and primar market marked-up fees have risen in tandem over time– it has grown 41 percent from 1996 to 2010, outpaced general inflation, which rose by approximately 30 percent during the same time period(Pray & Krueger, 2008).
TicketsNow. With max price limitations on resellers, which can even be less than the face value of the ticket, many consumers are enticed to resell on other sites as their profit could even offset the high fees that Ticketmaster pushes.
There are many economic implications of only allowing monopolies like Ticketmaster to resell instead of third-party people, as there is a decrease in welfare gains. Secondary markets allow the final buyers to gain consumer surplus and utility from attending the event, and the primary and secondary market sellers to earn a financial surplus. Overall, second-
As paperless ticketing has limited the amount of resellers in the secondary market, there is less supply and higher prices due to the competition. To prove this, Rascher and Schwarzt ran an empirical model with secondary market ticket prices, face value ticket prices, and ticketing fees. This model explained over 62 percent of the variation in secondary ticket prices and is associated with a 30-percent increase in ticket prices in the secondary market compared with conventional tickets. These empirical results statistically confirm that listed ticket prices are much higher for “paperless ticketing” seats than for conventional tickets. The short run equilibrium for monopolies is when price equals average revenue at the equilibrium quantity determined by the marginal revenue. However, reselling doesn’t benefit consumers when a band/sports

“
“
THIS RATE OF GROWTH OF TICKET PRICES AND PRIMARY MARKET TICKET FEES HAVE RISEN IN TANDEM OVER TIME, IT HAS GROWN 41 PERCENT FROM 1996 TO 2010.Figure 1. Breakdown of Ticketmaster Fees (Rascher & Schwarz, 2013). Note: the figure was presented in a report from the July 9-23, 2009 issue of Rolling Stone.
team and their promoter intentionally choose a price below the short-run max (monopoly) price, they under-supply the number of tickets their fans want to buy in the primary market. This excess demand created by promoters and bands creates the secondary market for tickets to these shows. According to economics professor Perry at the University of Michigan, “greedy ticket brokers (scalpers) have taken all of the blame for the secondary ticket market, when the real blame should be directed towards the non-market-based, anti-fan behavior of bands and their promoters”(Perry, 2011). While resellers gain the benefits of promoters and bands setting this

price more than consumers, ending scalping isn’t really in the best interests of the public if tickets are initially sold at the profit maximizing equilibrium price.
The recent Taylor Swift Ticketmaster scandal is an example of the issues that can arise with paperless ticketing. Ticketmaster was a primary market seller for Taylor Swift’s Eras tour tickets. During these sales, there were various presales for Verified Fans who submitted interest for this event in advance to ensure a priority in the sale of these tickets, along with Ticketmaster account verification to ensure that fewer bots enter these
MEGHNA KRISHNAqueues. During one of the presales, there was an unprecedented amount of bot attacks as well as fans that didn’t have presale codes to purchase tickets which resulted in too much traffic on the site with added system requests. This caused the site to crash. While there are many procedures that Ticketmaster has done to ensure that bots don’t actually get these tickets through user account validation and fan data verification, this did not stop these bots from going on this resale site and crashing the site. Ticketmaster could’ve done more to prevent this site crash due to the high demand for tickets prior to the presale. However, their Verified Fan implementation did result in a smaller portion of tickets in resale markets. Only 5 percent of tickets were on secondary markets instead of the 20–30% of inventory that is usually seen when Verified Fan isn’t implemented(Ticketmaster Business, 2022).
In addition, Ticketmaster has been under many investigations even prior to the Taylor Swift sales and is currently being investigated by Lina Khan, the current FTC chair, who helps enforce US antitrust laws. Khan “positioned herself as an advocate for leveraging antitrust laws to break up the powerful companies.”
Will her strong position among others in this lead to a change in Ticketmaster’s reign in the industry? In a recent Senate hearing against the antitrust implications of Ticketmaster, Bradish, head of legal advocacy at the American

Antitrust Institute, “advocated for the Justice Department to take new enforcement action against the company and for Congress to consider passing legislation that would clarify and strengthen U.S. antitrust laws, or require codes of conduct for digital ticketing platforms.” He also called for more transparency, especially into how Ticketmaster decides service fees. Ticketmaster’s relationships with major US venues were also heavily questioned by senator Klobuchar because these venues know that “if they move their primary ticketing business away from Ticketmaster they risk losing the revenue they earn from Live Nation concerts.” This can be seen in Ticketmaster, controlling more than 70% of the market for ticketing and live events; it controls much of the promotion of those events; and it either owns or has year-long exclusive contracts with many large venues. This co-dependent relationship with these venues needs to change, along with their limitations on secondary market sales. A solution to this could be to allow other resellers technological access to transfer tickets by lifting credit card restrictions. The effects of this benefiting the secondary market can also be seen at Stubhub, recently having made this change in their reselling model(NPR, 2023).
Overall, paperless ticketing has had a number of implications for both the primary and secondary ticket markets. Paperless ticketing can be beneficial for consumers, as it can help to reduce fraud,
make it easier for fans to attend the events they want to see, and makes buying tickets more efficient. However, there are many drawbacks to paperless ticketing as monopolies like TicketMaster control a significant portion of the paperless ticketing market. Ticketmaster often takes advantage of this power by setting high service charges, controlling the distribution of tickets, and limiting consumer choice, which hurts consumer welfare. The ticketing industry needs increased regulation to ensure that consumers have fair access to tickets and are not taken advantage of by monopolies like Ticketmaster.
United States of America et al. v. Ticketmaster Entertainment, Inc. and Live Nation, Inc., Antitrust Complaint, Case 1:10-cv-009139, January 25, 2010.
Pickert, Kate. “A Brief History of Ticketmaster.” TIME Business 2009.
Pray, Marie Connolly, and Alan B. Krueger. “Rockonomics: The Economics of Popular Music.” The National Bureau of Economic Research, 2008.
Harrington, David. “Uncapping Ticket Markets.” Regulation 33, no. 3 (2010):12.
On September 17, 2022, Wisconsin native Joey Giorgi scored a touchdown for the Columbia Lions. Surprisingly, Columbia’s ensuing 38-3 rout of Marist College wasn’t their most significant victory that week. Because just five days earlier, the university didn’t exist–at least, not according to US News & World Reports.
“Taylor Swift: The Eras Tour Onsale Explained.” Ticketmaster, 2022.
Rascher, Daniel A., and Andrew D. Schwarz. “The Antitrust Implications of ‘Paperless Ticketing’ on Secondary Markets.” Journal of Competition Law & Economics 9, no. 3 (2013): 655-708.
Pociask, Steve. “Paperless Tickets, Costly to Consumers - the American Consumer Institute.” American Consumer Institute, 2014.
Hurwitz, James D. “Restrictive Paperless Tickets: A White Paper by the American Antitrust.” American Antitrust Institute, 2012.
Knopper, Steve. “Inside Ticketmaster’s Empire: The Ticketing Giant Wants to Rule the Concert Biz. Should You Be Afraid?” Rolling Stone, 2009.
Perry, Mark J. “The Economics and Logic of Ticket Scalping.” The Trading Report, 2011.
Hogan, Michael. “Live Nation to Roll Out Dynamic Pricing, Everyone Else Just Rolls Eyes.” News Items. Quot-ing Mark.
Perry, Professor of Economics and Finance, University of Michigan (Flint Campus), 2011.
Treisman, Rachel. “The Senate’s Ticketmaster Hearing Featured Plenty of Taylor Swift Puns and Protesters.” NPR, 2023.
On July 8th, 2022, US News & World Reports announced that they would be removing Columbia University from their sought-after “Best National University Rankings” following a 21-page exposé released by Columbia faculty Michael Thaddeus. The report alleged that this Ivy League institution falsified data that it submitted to the magazine in an attempt to artificially boost their overall ranking. While the university was reinstated two months later (albeit with an unexplained sixteen-rank drop), many took this ruling as an opportunity to examine the shrouded yet powerful role of US News & World Reports.
Each year, millions of students embark on the journey towards higher education, and many
of them rely on the Best National University Rankings to solidify their decisions. According to Colin Diver, former dean of the University of Pennsylvania law school, this dependence is natural, as he explains, “It’s based on a not-irrational premise that you’re more likely not only to get jobs, but you’re more likely to get noticed, you’re more likely to have good connections. You’ll have a pedigree, and in America, a little of that is conferred by family, but most of it is conferred by education.”
There’s an issue with this premise, however. These prospective enrollees make these monumental decisions with no real certainty regarding the quality of education at any of these universities. How different is the 31st school in the country from the 48th? Seventeen discrete ranks separate two colleges that, for all anyone knows, are exactly the same! This dilemma gives way to the ultimate issue: How can one make a decision without actually knowing what it is they’re choosing to do? For an answer, one must visit a used car lot.
In 1970, about thirty-two years before Giorgi was born, UC Berkeley professor George Akerlof published
“The Market for Lemons”, a seminal paper on asymmetric information for which he received the Nobel Prize in Economics. The article’s title refers to “lemons”, a colloquial term for a car with a significant defect that appears identical to the rest of the lot. They contrast “peaches”, which are undervalued cars in good working order. Akerlof details that the conundrum of purchasing a used car is a gamble between receiving a lemon or a peach, with buyers essentially blind between the two. The used car market is thus an
IT’S BASED ON A NOT-IRRATIONAL PREMISE THAT YOU’RE MORE LIKELY NOT ONLY TO GET JOBS, BUT YOU’RE MORE LIKELY TO GET NOTICED, YOU’RE MORE LIKELY TO HAVE GOOD CONNECTIONS. YOU’LL HAVE A PEDIGREE, AND IN AMERICA, A LITTLE OF THAT IS CONFERRED BY FAMILY, BUT MOST OF IT IS CONFERRED BY EDUCATION.
exchange of asymmetric information, where the dealer is aware of the vehicle’s true status (i.e., lemon or peach) while the buyer is not. This information asymmetry affects both parties: buyers are forced to treat every car as if it was a lemon to protect them from being deceived, forcing dealers of peaches to accept a lower price for their functioning cars.
To overcome this, Akerlof and his coauthor Michael Spence highlight the effects of signaling, a tool that allows those with peaches to fetch an appropriate price for their car.
Spence suggested that if the dealer of a peach offered some signal, perhaps in the form of a warranty or test drive, to indicate confidence in the quality of their vehicle, it would alert buyers that the car in question was
indeed a peach. Conversely, if a dealer failed to offer such signals, it would be clear to buyers that the car being sold was a lemon. Spence described the effects of signaling through the job hiring process, another exchange of asymmetric information. Employers are uncertain of an applicant’s productivity, but through signals such as education and past expe-
example of an asymmetric information exchange on a massive scale. The quality of higher education is not directly observed, so universities instead send specific signals that are compiled by US News and delivered to students. In the absence of more concrete information, these signals play a pivotal role in overall application behavior. Harvard professor Michael Luca conducted natural experiments on these rankings which demonstrated that “an exogenous one-rank improvement leads to a 0.96-2.07% increase in applicants.” These ranks provide students with the most salient information regarding the quality of higher education, explaining the massive impact US News has on applications.
spending, but through these five alone, a list can be compiled that contains 80% of the top 20 schools in the country according to US News. As a consequence, instead of investing into the quality of their education, universities can target these key characteristics directly in what is known as signal manipulation. Through careful selection of interdisciplinary offerings, graduate coexistence, and selectivity rates, universities can manipulate the rankings and increase applications.
rience, they can predict their overall performance with greater confidence, and thus the worker can demand a higher wage.
That’s really interesting, but what does it have to do with colleges? Great question! The college selection process is an

That influence, however, is a double-edged sword. Signals can improve welfare if they accurately reflect the information at hand, but signals prone to manipulation may do more harm than good. Following Columbia’s investigation, the methodology behind the Best National University Rankings has been under intense scrutiny, and the data behind its results has been called into question. The magazine cites the Carnegie Classification of Institutions of Higher Education as its primary source of information, and the database itself highlights a few key factors that separate the elite institutions from the rest. Namely, these include a focus in the arts and sciences, high graduate coexistence, high full-time enrollment, high selectivity (in correspondence to standardized testing scores), and low transfer-in rates. The database relies on other factors, such as research
For students, this system provides them with a discrete (although potentially misleading) metric through which they can compare schools with more confidence, but this system only works if all players are honest. Columbia University was eventually reinstated in the rankings, although two former students filed a class action lawsuit against the university alleging that the falsified data defrauded them of an honest reflection of their education. Citing Luca’s work, they claim that misleading information in the US News rankings led them to pay a tuition fee disproportionate to the education they received. In recent months the law schools of Yale University, Harvard University, and even the University of Wisconsin have withdrawn from these rankings, citing issues with their misleading nature and intrinsic biases. While the students’ case has yet to be tried, this simply calls to further attention the
warped landscape of college decisions, and the potential ramifications of an asymmetric exchange gone wrong. When higher education is muddled with manipulated signals, it can be difficult for students to obtain a clear picture of what they are choosing between. Is it a lemon? Is it a peach? At the end of the day, nobody knows for sure until they get behind the wheel.

Hartocollis, Anemona. “Columbia Loses Its No. 2 Spot in the U.S. News Rankings.” New York Times, July 2022.
Hartocollis, Anemona. “U.S. News Ranked Columbia No. 2, but a Math Professor Has His Doubts.” New York Times, March 2022.
Akerlof, George A. “The Market for ‘Lemons’: Quality Uncertainty and the Market Mechanism.” The Quarterly Journal of Economics 84, no. 3 (1970): 488–500.
Campbell, Ravi, individually and on behalf of all others similarly situated v. The Board of Trustees of Columbia University in the City of New York. United States District Court Southern District of New York.
Cornett, Logan. “Law Schools Pull Out of U.S. News Rankings, Citing Harm to Legal Education.” University of Denver Institute for the Advancement of the American Legal System.
Hartocollis, Anemona. “U.S. News Dropped Columbia’s Ranking, but Its Own Methods Are Now Questioned.” New York Times, September 2022.
Luca, Michael and Smith, Jonathan. “Salience in Quality Disclosure: Evidence from the U.S. News College Rankings.” Journal of Economics & Management Strategy 22 (2013): 58-77.
Thaddeus, Michael. “An Investigation of the Facts Behind Columbia’s U.S. News Ranking.” February 2022.
Tokaji, Dan. “University of Wisconsin Law School Will Not Participate in U.S. News Survey.” University of Wisconsin Law School.
“Carnegie Classifications Undergraduate Instructional Program Classification.”
“Available for interviews during ASSA meetings” is likely the most common phrase spotted on Econ Job Market Candidates’ websites. Around January 6th to 8th, numerous economists and aspiring JMCs across the country crowded into New Orleans for the Allied Social Science Associations(ASSA) 2023 Annual Meeting. Beyond the scope of a rigorous conference, this three-day meeting also highlights a new round of hiring season as it performs as the primary market hosting the majority of interviews for tenure-track positions. The American Economic Association (AEA) oversees the entire process of simultaneous dual job searches between the candidates and departments and cre-
ates a centralized market mechanism accommodating pre-stage Signaling, primary-stage ASSA Interviews, and secondary-stage Scramble to monitor the recruitment process. To unveil the underlying mechanisms of job matching and this centralized Job Market, identifying the participants of the job market engaging in the dual searching process yields the desirable question of interest of how this searching structure improves the dynamics in these imperfect information games.
Job-seeking candidates and hiring departments are the agents engaging in dual matching in the Econ Job Market(Conlon et al, 2018). Candidates first interact with peers
within a program to decide whether to go for the job market for academic jobs or the industry. The candidates who are bound for academia then compete both within and across programs in a broader applicant pool for tenure-track openings and postdocs, each candidate with unique sets of characteristics. These sets contain both public and private information about the candidate and shape this dual job match into an imperfect information game between the candidates and hiring departments(Cawley, 2018).
On the program side, the hiring departments’ problem is relatively easy since they mainly seek to hire the best fits from the pool.
Publication records and teaching experience are more public and observable to the hiring departments since such information with job talk performance would directly endorse candidates’ profiles on CVs. In contrast, research potential and academic commitment appear more as private information since they are less likely for a department to assess these intangible and subjective characteristics. Therefore, the goal of the hiring departments is to identify the best fits for their programs through this dual job search and recruit value-added hires with imperfect information.

On the candidate side, the choice between academia or industry jobs depends on personal pathways and ambitions. However, such a decision can also become peer- and path-dependent due to
Figure 1. Framework: Dynamics within the Econ Job Market (Chu, 2023).
the specific program climate, peer effects, and the past placement records and policies. Particularly, an intuitive example can be a research subfield conflict within a program. The implicit ranking mechanism within a program can also refrain middle-ranked candidates from going for academia, considering the fact they may face severe competition against the “stars” in an already-narrow market(Figure 1). Yet, going for tenure-track positions can bring additional reputational rewards and carry out beneficial spillover effects on both the program and its candidates.
For instance, Northwestern University typically has strong cohorts of Theory candidates and got them placed exceptionally. Their fellow PhD students thus enjoy this reputational reward in both the ranking of the program and the rippling effect when entering the Econ Job Market later. Thus, a candidate’s problem can be specified as a maximization problem of utility payoffs, where the candidates maximize net reputational rewards considering their choices of career (i.e., academia or industry. Note: assumed strong preferences for academia over industry) and cohort effects (i.e., “stars” against “lemons”) in a given program and the same Econ Job Market (Camboni and Porcellacchia, 2022).
It is trivial to foresee the “stars” will easily get offers and be placed in better departments no mat-
ter which programs they apply to, considering their spectacular profiles. The rest of the candidates, if going for academia, will have more variations in their characteristics such that they ought to strategically find a well-fitting program to land and therefore adopt more randomized application profiles across different ranks/tiers of programs. This variation is well-illustrated in Figure 2, where Yi denotes the characteristic sets of candidates and wj is twisted to denote the overall reputational rewards/ranking of the programs
(Note: this Figure from Peters (2010) assumed identical firms and did not account for the search from the firms. Here, we want to think of the firms as sequentially ranked departments. The simultaneous search mechanism with heterogeneous setting was studied by Chade & Smith (2006)).

The variations in candidates also imply that each candidate applies to the hiring departments with some
ex-ante sorting mechanisms, in which tiers of hierarchy across the programs and reputational rewards benefiting the candidate are both taking place in response. The aim of the equilibrium in this dual job search is then crystal clear. Candidates fully acknowledge their own sets of characteristics and search for “fitting” openings under some ability/profile constraints and distributions. Even though it is an imperfect information game for the hiring departments, the programs receive a group of self-sorted job applications and thus get to recruit the best-quality new faculty from this facilitated cohort.
The dual job match seems complicated, but a reassuring claim is that doing an Econ Ph.D. nearly guarantees the candidate a job, including academic and industry positions(Auerbach, 2004).
Prior studies and survey statistics of the 2007-2010 Econ Job Market Candidates showed that each candidate applied to 107 positions in total and received 16.8 ASSA interviews, 5.7 fly-out campus visits, and 2.9 final offers on average (N=905) (McFall et al, 2015). One concern is that the Job Market can become a winner-take-all scenario where the “stars” are dominantly favored among the hiring departments, which leads to a bias in focusing on the average number of final offers received. Yet, in general, 92 percent of the candidates accept a job offer by the end of the hiring season, with 64 percent of them securing their first choice in the occupation types. This signals that both candidates and departments perform the dual job search in good coordination and find the best fit for each other in the Job Market(Cawley, 2018).
The centralized Econ Job Market guided by AEA solves the last puzzle of how candidates and departments efficiently and effectively go through this dual search process and find the best fit for each other. From all the above contexts, it is noticeable that the partitions of the characteristic sets would hardly be distinguished when the candidate pool gets immensely large (also see Figure 2). Such wide heterogeneities yet similarities in candidates impose burdens
on the hiring departments. That is, if the candidates do not capture the openings properly, or adversely if the information of a candidate fails to deliver to the hiring departments clearly (Coles et al, 2010), the chance of failure in this individual dual search matching drastically increases since the sub-game here did not land the candidate to at least the fitting departments, where theoretically a candidate should have matched under his/her/their unique set of characteristics(Gonzalez and Shi, 2010).
In response, AEA sets up Job Openings for Economists (JOE), and EconTrack information board as the central, main, and official employment coordinating platform, where all the Job Market Candidates get to browse the opportunities and select their matches with less searching costs and uncertainty. For hiring departments, the institutions get to recruit new faculty on a more standardized platform where they have a thicker and more competitive (self-sorting) applicant pool. To facilitate the matching process, the prestage Signaling is introduced to this centralized market to prioritize up to two job application signals for each candidate to express specific strong preferences in one’s candidate-department fits and climb up the sorting ladder received by the hiring departments. This more or less prioritizes the “best-fit” matches and allows departments to finalize the short-lists for interview. The following primary-stage ASSA Interview at the Annual Meeting hosts the majority of the job interviews. Set-
ting the central stage of interviews at a conference allows: 1) hiring departments to encounter a more fruitful job market pool as JMCs normally make their presences at the Annual Meeting to present their JMPs; and 2) the JMCs to better discuss the job openings and leave a further impression in hybrid meetings with the hiring departments. It is crucial to reiterate that the job searching process is an imperfect information game, and this central format of the ASSA Meeting offsets the potential information asymmetry between job-seekers and hiring institutions and thus helps the job searching and matching. The secondary-stage Scramble ultimately picks up those still actively seeking academic positions and creates a marketplace where Job Market Candidates would not be bothered by the outdated Fall recruiting information as the hiring departments gradually fill the tenure-track vacancies. By adopting a three-stage centralized market, AEA gets to oversee dual job searches and achieves its holistic goal of reducing search costs and uncertainty at all stages of the job-matching process.
The Econ Job Market is a miniature of the general labor market, and the variation and randomness in job placements of Ph.D. candidates highlight the essence of strategic interactions and matching between the prospective scholars and hiring departments. In
short, the job-seeking process can be deemed a single pipeline where dual and simultaneous job matching happens intensively along the way. Candidates with unique characteristics compete for tenure-track positions, while hiring departments seek to identify the best fits to add to faculty profiles. To prompt better searchings and matchings, AEA established this three-stage centralized market for the JMCs and the hiring departments to engage in a more-informed market dealing with numerous imperfect information matching. Indeed, job interviews are recently being accommodated to a virtual format after the pandemic, particularly for the first-round interviews as a nearly zero monetary cost option as the AEA committee suggested. Yet, the ASSA meeting still signals the largest field where simultaneous searches between candidates and institutions happen. By having a coordinated centralized market, all agents in the Econ Job Market envision a more efficient coordination by potentially accommodating the existence of an equilibrium in the dual search process.
Camboni, Matteo and Michael Porcellacchia. “Monitoring Team Members: Information Waste and The Self-Promotion Trap.” Job Market Paper, 2022.
Cawley, John. “A Guide And Advice For Economists On The U.S. Junior Academic Job Market.” American Economic Association, 2018.
Chade, Hector, and Lones Smith. “Simultaneous Search.” Econometrica 74, no. 5 (2006): 1293–1307.
Chu, Eric H. “A Network Approach to Academic Inclination and Placement.” Work in progress, 2023.
Coles, Peter, John Cawley, Phillip B. Levine, Muriel Niederle, Alvin E. Roth, and John J. Siegfried. “The Job Market for New Economists: A Market Design Perspective.” Journal of Economic Perspectives 24, no. 4 (2010): 187-206.
Conlon, John J., Laura Pilossoph, Matthew Wiswall, and Basit Zafar. “Labor Market Search with Imperfect Information and Learning.” NBER Working Paper, no. 24988, 2018.
McFall, Brooke Helppie, Marta Murray-Close, Robert J. Willis, and Uniko Chen. “Is It All Worth It? The Experiences of New PhDs on The Job Market, 2007-10.” Journal of Economic Education 46, no. 1 (2015): 83-104. Peters, Michael. “Noncontractible Heterogeneity in Directed Search.” Econometrica 78, no. 4 (2010): 1173-1200.
Auerbach, Alan J., Francine D. Blau, and John B. Shoven. “Panel Discussion.” American Economic Review 94, no. 2 (2004): 286290.
Gonzalez, Francisco M., and Shouyong Shi. “An Equilibrium Theory of Learning, Search, and Wages.” Econometrica 78, no. 2 (2010): 509537.
The future is here, and it’s powered by artificial intelligence (AI). From virtual assistants to self-driving cars, AI is transforming every aspect of our lives. AI is changing the physics of financial services - weakening the bonds that have historically held together financial institutions while creating new centers of gravity where new and old capabilities are combined in unexpected ways[5]. Over the past decade, AI has emerged as a powerful tool for financial institutions, allowing for more efficient and accurate operations, improved customer service, and the creation of new financial products and services. With these advancements come changes to the job market, as some jobs become automated and others become more specialized. This article explores the impact of the AI revolution on the financial industry and discusses strategies for adapting to these changes. So buckle up, because the AI revolution is here to stay, and we are diving headfirst into the world of finance and technology.
The economic industry stands on the brink of a paradigm shift, and
it is all thanks to Artificial Intelligence. Prediction models that operate autonomously, without human labor, may be poised to assume the mantle of dominant players in the financial realm. Artificial Intelligence (AI) is the driving force behind innovation and growth. As the AI revolution takes hold, the financial industry is being transformed in ways that were once thought impossible. This is witnessed in the form of AI aiding in automating tasks, improving fraud detection, enhancing customer experience, enabling personalized financial advice, and increasing operational efficiency.
The AI revolution refers to the profound changes occurring in various industries, including the financial sector, driven by the increasing use of artificial intelligence technologies. It involves the application of machine learning, deep learning, and other AI-related technologies to automate routine tasks, uncover new business opportunities, and enhance decision-making processes, among other things. Be it stock trading or fraud detection, AI is recasting the way we handle money and shaping the future of finance. The financial industry makes use of
the ability of AI-powered systems to analyze large amounts of data to identify patterns and anomalies that may indicate fraudulent activity, analyze market data and execute trades at high speeds. AI models based on pre-set algorithms also help in analyzing data on market trends, risk, and other factors to optimize the performance of a portfolio. According to a Deloitte report, “AI-driven systems can process vast amounts of data, including unstructured data, and identify patterns and anomalies that humans might miss”[4]. The report states that AI-powered fraud detection systems can reduce false positive alerts by up to 95% compared to work done manually, resulting in significant cost savings[4]. This helps financial institutions identify and mitigate potential risks more effectively.
The impact of AI on the financial industry has been significant over the last decade, both in terms of market research and employment opportunities. AI-powered systems have enabled financial institutions to gain insights from vast amounts of data that were previously challenging to analyze. For instance, AI systems can analyze market trends and customer behavior to identify
new product opportunities and predict market fluctuations, which enhances decision-making and competitiveness. AI has led to the automation of many routine and repetitive tasks, freeing up human employees to focus on more complex and higher-value tasks. For example, AI-powered chatbots and robo-advisors have reduced the number of jobs available for human customer service representatives and financial advisors[2].
A study by Accenture found that AI-powered investment strategies outperformed human-managed portfolios by 2.5%, and the gap between the performance of human-managed portfolios and AI-managed portfolios is likely to widen[3]. This compounding effect could lead to a significant shift in the financial industry, as investors increasingly turn to AI-powered strategies to maximize their returns. This has led to growing concerns that AI may take over human jobs. Howev-
er, a report by PwC suggests that AI will serve complementary roles, create more jobs than it will replace, and lead knowledge and economic growth with new roles created in areas such as data analysis, AI development, and information technology[1]. The use of AI can also lead to new job opportunities and economic growth, requiring a wide range of skills such as data science, software development, and AI engineering.
In 2022, we saw the rise of ChatGPT, a large language model trained by OpenAI. ChatGPT’s natural language processing and generation capabilities have opened up a discussion about the possibilities for businesses and organizations, and the financial industry is no exception. It is worth noting that a large number of organizations, such as Google, JPMorgan Chase, and Wells Fargo, have employed interactive models
for their websites and customer support services in the last decade. These interactive models can take various forms, such as chatbots, virtual assistants, and automated phone systems, and can provide customers with quick and efficient solutions to their queries. In fact, by leveraging AI and machine learning, these systems can also learn from customer interactions, identify patterns, and continuously improve their performance over time. As a result, organizations can save on labor costs, reduce wait times, and improve customer satisfaction. This trend is expected to continue as more companies seek to enhance their customer experience and stay competitive in the market. Interactive AI like ChatGPT has the potential to revolutionize the way financial institutions interact with their customers. This can also improve the customer experience by allowing customers to access information quickly, complete transactions, and get help with their finances without needing to go through a human representative.

The debate about AI models taking over people’s jobs is particularly essential in the financial industry, where AI has been used to automate routine and repetitive tasks causing a fear that they will be able to completely take over even more advanced jobs such as financial trend analysis and mar-
ket research, leading to massive job displacement and unemployment. The impact of AI on unemployment is a complex issue and the effects will likely vary depending on the specific job in question. However, the increased efficiency and productivity brought about by AI can lead to new economic opportunities and new jobs. A historical example of AI leading to new job opportunities and economic growth in the finance industry is the introduction of ATMs (automated teller machines) in the 1970s. While some people feared that ATMs would lead to job losses for bank tellers, the machines actually created new job opportunities in fields such as ATM maintenance and customer service.
The rapid advancements in AI technology over the past decade require discussing strategies to mitigate its potential negative effects on employment opportunities. To address this, governments and businesses can implement retraining and upskilling programs for displaced workers, invest in education and training programs for the next generation, and consider policies like universal basic income to support those affected by AI-induced unemployment. Individuals can also take steps to avoid job displacement by working towards improving their skill
set to stay current with the latest technologies and trends in their field, and developing difficult-to-automate skills like critical thinking, creativity, problem-solving, and emotional intelligence. This can be done by attending workshops, conferences, and online training programs. Individuals can also focus on enhancing skills such as data science, and software engineering, which is essential for the development and implementation of AI systems and will be in high demand as more and more companies adopt AI technology.
The AI revolution has transformed the financial industry in countless ways. From more efficient operations to improved customer service, and even the creation of new financial products and services, the impact of AI is undeniable. We can expect to see even greater integration of AI into the financial industry. While some roles may become automated, there will also be new opportunities for data scientists, AI engineers, and AI experts. Financial institutions must invest in AI-related technologies and strategies, such as including retraining and upskilling programs for their workforce, to mitigate any negative impacts on employment. It’s safe to say, AI won’t take over the financial world. AI can automate specific tasks and improve efficiency, but it still requires oversight and decision-making from humans. Additionally, there are regulatory and ethical considerations that will limit the use of AI in finance. It’s more likely that AI will continue to augment
and enhance the capabilities of financial professionals, rather than replace them entirely. In short, the AI revolution is here to stay, and it’s up to us to adapt and thrive in this new era of finance.
Frangoul, Anmar. “Artificial Intelligence Will Create More Jobs than It Destroys? That’s What PWC Says.” CNBC, July 17, 2018.
Iacurci, Greg. “Robo-Advisors Are Growing in Popularity. Can They Really Replace a Human Financial Advisor?” CNBC, January 16, 2022.
Reilly, Athena, Joe Depa, and Greg Douglass. “Scaling AI: From Experimental to Exponential.” Accenture, February 10, 2023.
Stier, Cary, and David Dalton. “Artificial Intelligence: The Next Frontier in Investment Management.” Deloitte. Accessed March 14, 2023.
“The New Physics of Financial Services. Understanding how artificial intelligence is transforming the financial ecosystem”, World Economic Forum, August 2018
 By Alexandra Dogaru
Look around you. How many expensive labels do you see? Does everyone have the latest iPhone? Or a Canada Goose parka? How about an overpriced pair of Lululemon leggings? These luxury brands are everywhere, and it seems more and more people are investing in them; however, not everyone has the means to comfortably afford to spend large amounts of money on such expensive items. What helps explain this paradox is people’s desire to conform, the concept of Veblen goods, herding behavior, and easy access to credit. These factors have thus changed the economics of some of the most popular luxury brands, which explains their wide prevalence among all social classes.
To better understand the strange economics of well-known brands, it helps to assume that they follow the economic rules of luxury goods and test this theory. Economic theory explains how luxury goods have a high elasticity to income, meaning that the wealthier an individual is, the more she can afford expensive goods[1]. This intuitive claim implies that luxury items should be accessible only to those fortunate enough to have higher incomes. But this is the opposite of what is happening in the real world. Close observation
that does not respond to incremental changes in income.
of human behavior shows how most people own luxury items, regardless of their income. A study by Nelissen and Meijers explains how people generally choose to buy luxury items as they symbolize an increase in
One economic concept that might help explain the behavior of what most people consider luxury items is the concept of Veblen goods. These goods have an upward-sloping demand curve, meaning that the more expensive they get, the greater the quantity demanded, as people hope to raise their social status[3]. This definition better matches the behavior of expensive brands, as it acknowledges both the component of luxury and the uncommon demand laws that govern such products.

social status[2]. In other words, the human desire to appear prosperous and have a higher position in society overrides the true economics of the situation. Implicitly, those in lower income brackets presumably have a greater tendency to overcome their circumstances, which means they are more inclined to desire to signal a higher status through expensive items. Thus, luxury goods fail to conform to the microeconomic theory of high elasticity of demand, as there are behavioral factors that override such principles. Instead, these expensive goods seem to have a demand curve
While Veblen goods might explain the behavior of many consumers, it is still unclear why the popularity of some established brands has increased over the years. One explanation for the increase in the popularity of established brands over the years may be the recent rise of social media platforms such as Instagram and Facebook. Because these platforms allow consumers to connect with a broad audience and share their experiences and lifestyles, the motivation to display one’s status and conform to the norm is higher[4]. In other words, social media has enabled individuals to engage in broader social networks consisting of distinct individuals with varying levels of income and status. Because of these differences in wealth and the inability to truly gauge one’s economic situation through social media posts, people feel pressured to display
their status and compete for fame (as measured by the number of likes and impressions on a social media post). Another element that impacts people’s desire to compete for attention is the sense of entitlement they feel towards their luxurious items– the higher it is, the greater the incentive to display expensive purchases online and seek social validation[5]. Thus, those who seek attention from their online social circles feel attached to such expensive purchases. For them, luxury items are part of their identities and represent a means through which they get the satisfaction of receiving online attention. Moreover, behavioral economics research points to the concept of herding, which refers to individual decisions that result from desiring to imitate a group rather than through independent analysis of information [6]. In other words, people are often susceptible to associating with a group’s ideas rather than forming independent judgments. This psychological component, combined with the additional satisfaction gained from displaying status, seems to explain the increased prevalence of some luxury brands.
While social media explains the increased popularity of some luxury brands, it fails to explain how everybody can afford to buy expensive items. One factor that helps uncover the financial means of most consumers, especially the young ones, is the recent rise in financial phone apps that allow people to make short-term loans [7]. Easy access to money and increased peer pressure to conform seem to be two key elements of the mystery behind the behavior of luxury goods. While these factors benefit large corporations, they might have severe economic consequences. One possibility is that easy access to money could increase the risk of people defaulting on their loans, which ultimately might cause a recession. In other words, obtaining credit through a simple click can
make consumers more susceptible to overspending. In the long run, such overspending might cause financial hardships and might put consumers at a high risk of default.
Overall, people’s desire to overcome their financial conditions and appeal to a higher social group has created a society that lacks sound economic reasoning. While purchasing expensive items can increase one’s utility and perceived social status, the long-term consequences of such spending can negatively impact people’s financial situations. In other words, luxury branded products are not genuinely worthy investments as they provide little real economic benefit besides the satisfaction of belonging to a group. While such

spending behaviors seem irrational in relation to budget constraints, there is the possibility that the concept of opportunity cost is also involved; the lower one’s income, the greater the opportunity cost of not owning luxury brands. In other words, the marginal utility of purchasing expensive items is negatively correlated with income- the lower one’s income, the greater the utility associated with an additional purchase of an expensive item. Either way, behavioral biases override logic and the economic theory regarding luxury goods.
In conclusion, the next time you feel compelled to spend a significant portion of your income towards a fancy new iPhone or parka, remember that the value of such items lies solely in others’ perceptions of their worth. After all, such expensive

Chen, J. “Veblen Good: Definition, Examples, Difference From Giffen Good.” Investopedia, January 18, 2023.
Kemper, J. A., Bai, X., Zhao, F., Chiew, T. M., Septianto, F., Seo, Y. “Sharing Luxury Possessions In The Age Of Digital Experience Economy: Consumption Type And Psychological Entitlement.”
Journal of Business Research 142 (2022): 875-885.
items seem to fail to satisfy the definition of luxury goods; instead, they derive their value solely from their popularity among various groups of individuals. What might seem a luxury to a group might only be a normal good to others. So, is it worth buying social status?
Kemper, J. A., Bai, X., Zhao, F., Chiew, T. M., Septianto, F., Seo, Y. “Sharing Luxury Possessions In The Age Of Digital Experience Economy: Consumption Type And Psychological Entitlement.” Journal of Business Research 142 (2022): 875-885.
Baddeley, M. “Herding, Social Influence And Economic Decision-Making: Socio-Psychological And Neuroscientific Analyses.” Philosophical Transactions of the Royal Society of London. Series B, Biological Sciences 365, no.1538 (2010): 281-290.
Kenton, W. “What Is a Luxury Item (aka Luxury Good)? Definition and Examples.” Investopedia, February 13, 2021.
Nelissen, R. M. A. and Meijers, M. H. C. “Social benefits of luxury brands as costly signals of wealth and status.”
Evolution and Human Behavior 32 (2011):343-355.
The Economist. “How The Young Spend Their Money.” January 16, 2023.
In 2022, a series of events shook the global economy. The implosion of FTX, the collapse of cryptocurrencies, and a European gas crisis raised concerns about the possibility of a global recession in 2023. Eric Rosengren, the former president of the Boston Federal Reserve, has predicted that a mild recession in the U.S. economy is “quite likely.” (Gilchrist, 2022) During a recession, consumers tend to reduce their spending on non-essential goods, including luxury products and investments such as housing. This may lead to a price collapse for these products.
In fact, the housing market in Madison has entered a downturn recently,
as marked by Zillow statistics. After the outbreak of COVID-19, the median listing price for homes in Madison skyrocketed, and this trend continued for more than two years, from 2020 to mid-2022. However, towards the end of 2022, Zillow reported a decline in Madison’s median home value of 6099 dollars, which may indicate the onset of the next recession. The question is: What happened to the surge in Madison’s housing prices during COVID-19, and will the housing bubbles collapse at some point during the impending recession?

In January 2020, officials declared the outbreak of COVID-19. Since
then, Madison’s residential real estate market has experienced an unexpected boom. According to Zillow, the typical median home value in Madison increased by a remarkable rate of 33.18%, rising from $279,764 in January 2020 to $372,611 in October 2022 (Zillow). This surge in the residential housing market is due to fundamental forces of supply and demand.
On the demand side, COVID-19 has altered home preferences. People tend to focus on the working compatibility of a house instead. During quarantine, restrictions such as city lockdowns and limiting contact have increased people’s anxiety and uncertainty about tra-
ditionally-separate work lifestyles. Investigations in Málaga and Poland have confirmed that work preferences have shifted since the outbreak of COVID-19. Instead of prioritizing public transportation when purchasing a home, workers are now evaluating the availability of additional rooms as potential office space. This new trend has remarkably contributed to the stability and growth of the housing market, even during the COVID-19 recession.
On the supply side, the Madison housing market shrank due to infection concerns, uncertainty, and limited new construction. According to the Federal Reserve Bank of St. Louis, the active listing count for houses in Madison has dropped significantly from 1,135 units in Jan 2020 to 410 units in Jan 2022 (ST. LOUIS FED), representing a decrease rate of 63.87%. Infection concerns have impacted suppliers’ decision-making processes. The U.S. Census statistics show that people aged 50 and above are the majority of homeowners in the country, and this group is highly vulnerable to COVID-19 mortality statistics in Wisconsin. As a result, fewer houses have been listed for sale as people are hesitant to risk virus infection by showing their properties to potential buyers. Moreover, the uncertainty of the future has played a critical role in the reduction of supply. According to Benjamin Keys, an economist at the Wharton Business School at the University of Pennsylvania,
“Who wants to sell a house in the middle of a pandemic? That’s what I keep coming back to. Is this a time you want to open your house up to people walking through it? No, of course not.” (Bui and Badger, 2021) Finally, limited new construction in Madison has also contributed to the shrinkage in supply. The City of Madison Planning’s Current Development Proposals show that only 32 townhouses are under construction in 2022, along with 44 units in 2021 (32 single-family houses and 12 townhouses) for sale (City of Madison DPCED Planning). This limited new construction activity has further reduced the supply of houses available in the Madison housing market.
Apart from the direct sellers and buyers in the Madison housing market, there is another price variable
that comes from visible governmental intervention. In an effort to stimulate the market during the COVID-19 recession, the Federal Reserve lowered interest rates to historical lows and promised to keep rates low for an extended period of time. This has led to a significant decrease in the 30-Year Fixed Rate Mortgage Average in the United States, dropping from 3.51% on Jan 30, 2020, to 2.65% on Jan 7, 2021 (ST.LOUIS FED), the lowest average mortgage rate in 50 years. This has made mortgages more affordable for buyers and has elevated the demand for houses, shifting the demand curve outward. In addition, the White House announced COVID-19 Forbearance and Foreclosure Protections for Homeowners in September 2020 (The White House,
2021), which was extended on Feb 16, 2021. This mortgage relief policy has prevented banks from repossessing properties and putting them up for public auction, thus reducing the supply of houses available for sale and leading the supply curve to shift inward. The government interventions in response to the COVID-19 pandemic have contributed to a rise in house prices, as the increase in demand coupled with the decrease in supply caused by these interventions has driven up prices in the Madison housing market.
The impending recession raises questions about the future of housing prices in Madison. Will the housing market bubble collapse? Looking back at the 2008 financial crisis and the bursting of the real estate bubble, we will ana-

lyze the three main indicators: priceto-rent ratio, price-to-income ratio, andmortgage rate, as discussed in the work of Diamando Afxentiou, Peter Harris, and Paul Kutasovic (2022), to better depict the current situation of the Madison housing market. The first potential indicator of a housing market bubble is the price-to-rent ratio, which is calculated as the median home value divided by the median annual contract rent. This metric is used as a benchmark for estimating whether it’s cheaper to buy or rent a property. Trulia, an American online real estate marketplace, which is a subsidiary of Zillow, sets the thresholds as follows: a price-torent ratio of 1 to 15 indicates that buying is more favorable, a ratio of 16 to 20 indicates that renting is typically more favorable, and a ratio of 21 or more indicates that renting is much more favorable (Trulia). In this analysis, median home value comes from Federal Reserve Eco-

nomic Data, an online database source created and maintained by the Research Department at the Federal Reserve Bank of St. Louis, while median annual contract rents are acquired from Zumper, a rental agent company that records each listing accurately. Rental properties can be simply divided into five major categories in Madison: studio, one bedroom, two bedrooms, three bedrooms, and four bedrooms. For each category, there are different rent distributions and fluctuations. Since we view the rental market as a whole, each category has been weighted by the number of bedrooms it includes, and then used to calculate the average rental price and priceto-rent ratio. The graph displays an intriguing seasonally cyclical upturn, with all price-to-rent ratios exceeding the threshold of 21 set by Trulia. In September of each year, the price-to-rent ratio

drops to a local minimum, then gradually rises to a local maximum during the period of March to May. This cyclical pattern may be attributed to the high demand for rental properties in the fall semester, when faculty and students return to UW-Madison, and a subsequent cooling effect during the school’s summer break. If so, it is not enough to simply abuse the ratio of prices as a single primary indicator to predict whether it is better to buy or rent, as the large population in school clearly affects the market. In summary, even though the price-to-rent ratio exceeds the 21 threshold, it is not easy to say that people should rent instead of buying a house in Madison, as either school faculty or students are also involved in rescaling the indicator, but the overall upward
trend still hints at overvaluation in the housing market.
The price-to-income ratio is another important metric used to evaluate the affordability of houses. It is calculated by dividing the median home value by the median household income, and its value indicates the extent of difficulty in affording a house. In Madison’s case, both the median listing house price and median household income data also come from Federal Reserve Economic Data. This article focuses on the timeframe from 2016 to 2021. Since annual median household incomes are estimated each year while house prices recorded per month, this article applies the arithmetic average of monthly house prices recorded per year to calculate annual median house prices and then price-toincome ratio. Finally, estimations
of household income in Dane County have been used as a proxy of potential buyers’ income in the Madison local market.
The graph shows a relatively consistent upward trend in priceto-income ratio, which reached its peak of 4.95 in January 2020 and has remained at this level since then. This upward movement continued even before the COVID-19 pandemic, indicating the likely unaffordability of house prices in Madison, and a turning point appeared in 2019, creating a significant break. However, it is possible that the impact of the COVID-19 pandemic may worsen the situation and cause the price-to-income ratio to reach its highest point in the last six years, making housing even more unaffordable.
The third indicator is the mortgage rate. To combat severe inflation, the Federal Reserve sticks to the hawkish monetary strategy of elevated interest rates, which has resulted in higher mortgage rates in recent years. However, the 30year fixed rate mortgage average in the United States is still relatively low compared to historical levels in the 1900s (ST. LOUIS FRED), as shown in the graph. The rising mortgage rate may help cool down the housing market in a moderate way, but the situation caused by supply and demand fundamentals cannot be solved completely by this secondary tool.
After the outbreak of COVID-19, both supply and demand shifts forced Madison home prices upward. On the supply side, infection concerns, future uncertainty, and limited new construction restrain house listing numbers, while people’s preference for altering houses into workplaces affirms the solid boosting needs during the COVID recession on the demand side. As a result, reduced supply and increased demand forced housing prices to skyscraper levels.
During the 2008-2009 housing crash, economists learned that three potential indicators could forecast a housing bubble burst: the price-to-rent ratio, which helps determine whether it’s better to buy or rent; the price-to-in-
come ratio, which measures affordability; and mortgage rates, which can dampen buying enthusiasm when they are high. Through investigation of the price-to-rent and price-to-income ratios, it is found that when these two indicators continue to rise, they may be flashing a warning sign. However, the impact of rising mortgage rates can offset this warning to some extent. Therefore, we expect only a slight change in Madison’s local housing market– even during a recession. Moreover, the cyclical pattern of the price-to-rent ratio suggests that the school population may have omitted impacts on the market. There is little research on how they get involved in the housing market. Further research is needed to investigate the potential roles of these players and their participation in the context under study.
Afxentiou, D., Harris, P., and Kutasovic, P. “The COVID-19 Housing Boom: Is a 2007–2009-Type Crisis on the Horizon?” Journal of Risk and Financial Management 15, no. 8 (2022): 371.
Bui, Q., and E. Badger. “Where Have All the Houses Gone?” The New York Times, October 22, 2021. City of Madison DPCED Planning. “817 Big Stone Trail-Planning -DPCED.”
City of Madison, n.d. Zumper. “Average Rent in Madison, WI and Cost Information.” Accessed March 8, 2023.
Divounguy, O. “Declining Demand Drives Price Pullback.” Zillow, October 12, 2022.
Gilchrist, K. “U.S. likely headed for mild recession in 2023: Eric Rosengren.” CNBC, November 8, 2022.
Kocur-Bera, K. “Impact of the COVID-19 Pandemic Era on Residential Property Features: Pilot Studies in Poland.” International Journal of Environmental Research and Public Health 19, no. 9 (2022).
Rosa-Jiménez, C., and C. Jaime-Segura. “Living Space Needs of Small Housing in the Post-Pandemic Era: Malaga as a case study.” Journal of Contemporary Urban Af airs 6 (2022): 51-58.
ST. LOUIS FED. “Housing Inventory: Active Listing Count in Madison, WI (CBSA).” FRED, n.d.

ST. LOUIS FED. “30-Year Fixed Rate Mortgage Average in the United States.” FRED, n.d. Trulia. “Trulia.com Introduces Rent vs. Buy Index.” Trulia, n.d.
The White House. “Fact Sheet: Biden Administration Announces Extension of COVID-19 Forbearance and Foreclosure Protections for Homeowners.” 2021.
One can feel in the air that the United States has a housing affordability problem. Surveys suggest pessimism about the ability of young people to afford homeownership (Sechopoulos 2022). Both the Biden and Trump White Houses put forward plans to reform housing regulations, while cities and states have toyed with a wide variety of proposals, from liberalization to rent control
(Gyourko and Krimmel 2021). These concerns are on to something. House price to income ratios – a key measure of unaffordability – have been increasing in the US over the last several decades, from a median of 3.2 in 1988 to 4.2 in 2017 (Figure 1, Hermann 2018). As average house prices in some metropolitan areas creep past $800,000, concerns about affordability extend beyond the poor to the middle class(Gyourko and Krimmel 2021).

As governments consider policy reforms, it is important to understand why we have this problem. In particular, we must acknowledge the role that current policies play in exacerbating conditions of unaffordability if we are to have any hope of designing better ones. Local land use regulations such as zoning, which has become prevalent in the US since its introduction a century ago, create problematic incentive structures that give local homeowners the power and the incentive to restrict supply. Understanding how these incentives operate makes our current outcome easier to comprehend.
We can start to investigate this problem by examining the good in question. Housing, like any other type of structure, requires floor space. That might sound roughly equivalent to land, but it is not. Floor space indeed requires land, but the amount of floor space can vary tremendously for any quantity of land, depending on how that land is developed.
When land is cheap and plentiful, as in rural settings with low demand, developers spread capital over large amounts of land, and build little floor space per unit of land. When land is scarce and expensive, as in high-demand urban settings, developers substitute capital for more land and build up, producing the tall urban buildings we are familiar with. Tall buildings are not
merely an aesthetic or architectural choice. They provide more floor space for a given amount of land (Bertaud 2018). The US is not running out of land. Only 3.2% of the contiguous US is urbanized, including the area used for transportation (Fischel 2015). Our key issue is not the quantity of land, but rather the supply of floor space on that land.
In many desirable urban areas, the current density appears low enough to accommodate plenty of new housing. In Los Angeles County, for instance, there are only 1.38 units of housing per acre, including condominiums. The median price for an LA home is over $600,000 (Glaeser and Cutler 2021). Los Angeles has had many decades to develop. Why hasn’t it become more dense? As in most of the US, LA’s zoning codes place limits on the density of the housing that is allowed to be built.
In the early 20th century, a novel planning concept called zoning emerged, initially in Europe. Its core idea was to separate incompatible land uses – think of it as a way to deal with negative externalities. The cities of the day were infamous for the filth and pollution that accompanied mass industrialization. By regulating what could go where, cities could ease the anxieties of
residents who wanted to live in clean and peaceful neighborhoods.
The Department of Commerce, under Secretary of Commerce Herbert Hoover, called a committee to lay the groundwork for zoning in the United States. In 1922, the committee produced the Standard State Zoning Enabling Act, a model law designed to be adapted into legislation at the state level. State enabling acts rapidly followed, which gave municipalities the authority to zone.
Local governments were given control over zoning in their jurisdiction, while the underlying structure of the policy was fairly uniform throughout the country. This hints at our current problem: while an affordability problem in any city is unique and potentially solvable locally, the incentives that give rise to the problem are similar throughout the country.
Today, zoning is present in almost every major city in the US (Houston is the only major exception; it regulates development with other methods). Under zoning, a municipality divides its land into zones, each of which has its own set of rules governing what is allowed to be constructed. Some common rules are those restricting land use type (i.e. residential, commercial, industrial), building height, floor area to lot area ratio, minimum lot size (in residential developments), minimum setbacks from the street, and minimum amounts of parking [1]. These zoning measures can be used to restrict the density of a zone or of
BY ZACHARY GOLDENan entire municipality if they are applied widely.
While the basic idea of a regulatory framework to separate incompatible uses and give locals control over their neighborhoods seems harmless, zoning is often employed in ways that go far beyond the management of externalities. Many communities use zoning to favor low-density residential uses, particularly single-family homes– meaning that, in these zones, dense residential uses are prohibited. In many major US cities, more than 70% of residential land only allows single-family homes (Badger and Bui 2019). Economist William Fischel has argued that homeowners vote for this exclusionary zoning because it benefits their rational self-interest (Fischel 2015). As owning a home has become more prevalent over the past century, many American households now store much of their wealth in this single undiversified asset. Because of the potential for nearby development to adversely impact home values, homeowners are wise to be cautious over what goes up next door. Homeowners are thus incentivized to use their control over zoning to prevent any local change that could negatively impact the value of their largest asset. Fischel argues that they utilize exclusionary zoning essentially to perform as a form of home value insurance (Fischel 2004). By preventing any potentially undesirable development, homeowners can prevent
local changes that might reduce the value of their property.
Note1: These are just a few common items – some zoning codes get much more intricate. New York City, for example, has a small district in SoHo in which only artists are allowed to reside. Those who wish to live there must apply for an “artist certification” from the city’s Department of Cultural Affairs, by submitting a portfolio of their work. 45% of applications are refused (Bertaud 2018). Madison has an insyncratic rule of its own: no building within 1 mile of the Capitol can be taller than it. This is technically a state law, not a part of Madison’s zoning code (Wisconsin Stae Assembly 1990).
Note2: Supply constraints can also mean more volatility, since a market with an inelastic housing supply will have greater price fluctuations in response to changes in demand (Glaeser 2012).
Note3: This is not just a local phenomenon; high prices may inhibit workers from moving from less productive to more productive regions.
This can manifest itself in many ways. Few would argue that a polluting factory should be allowed to locate in a peaceful suburb against the protests of residents. Multi-unit residential buildings, however, add to the supply of housing in an area, reducing scarcity and thus reducing one source of upward pressure on prices. Homeowners are incentivized to veto those, too. The homeowners who can vote for these regulations can benefit from greater stability in their neighborhood and security in their housing investment, but those who do not live in a given community and thus cannot vote on its regulations bear the costs. When exclusionary zoning prohibits dense housing, it does two key things to
the local housing supply:
1. It restricts the range of available housing, allowing expensive homes while prohibiting cheaper apartments.
2. It restricts the overall level of supply, since density restrictions, when widely applied, can serve as a constraint on the quantity of housing units. Once much of an area’s land is already filled with low-density housing, the only way to build more housing is to convert that low-density housing into higher-density housing (or to replace other land use with more housing). By prohibiting more density, exclusionary zoning constrains the housing supply from expanding in these areas.
Both of these things make it more expensive for an outsider looking to move into an area – and since one can only vote in a municipality in which one already lives, there is little that outsiders can do about it.
Over the past century, the government of cities has also become more fragmented. Instead of the central city annexing land as settlements have expanded, many suburbs have become independent municipalities. Many of these suburbs consist largely of low-density housing, and residents have incentives to keep it that way. When a city is surrounded by such municipalities, the expansion of the housing supply for the whole metropolitan area can be slowed.
With an understanding of the incentives, the outcome becomes easy to predict. Large areas in US cities are
zoned for single-family homes, often accompanied by minimum lot size requirements that explicitly limit density. Aside from the isolating and resource-hungry nature of developments under these rules, long decried by urbanists and environmentalists, the practice restricts the supply of housing around the central city[2].
It isn’t just those who struggle to find housing who suffer. When supply is constrained in the most productive cities, restrictions on the housing supply in productive metropolitan areas damage the economic output of the entire nation. Spatial mismatch or misallocation occurs when workers are unable to locate near productive firms. Figure 2 illustrates mismatch in the San Francisco Bay Area, home to many leading tech firms[3]. One recent paper estimates that spatial misallocation caused by restrictions on housing supply “lowered aggregate US growth by 36 percent from 1964 to 2009” (Hsieh and Moretti 2019).

Is housing affordability a local problem? Yes. In each municipality, voters could decide that they want more residential development, and thus a more plentiful and affordable housing stock. However, so long as many voters possess two things: (1)much of their wealth stored in their home and (2)the political authority to
BY ZACHARY GOLDENprevent development that could hurt its value – voters anywhere have both the incentive and the ability to use local government to restrict supply. Thus the problem is both local and national. The incentive structure is similar throughout the country because the underlying policy structure is similar throughout the country. Given that homeownership and zoning have become established American institutions, this problem may be complicated to unravel.
Public opinion could change locally with a greater recognition of the problem, potentially overriding the forces of narrow yet rational self-interest. YIMBY (Yes in my backyard) movements, promoting development at a local level, are trying to counteract the force of the NIMBYs (Not in my backyard). They make a compelling case that a more dynamic city is ultimately beneficial. If public opinion swings in their favor in any given municipality, zoning codes could be changed, or at least more projects could be granted zoning variances.
The other option is policy reform. Given the relatively homogeneous structure of zoning policies nationwide, it is likely that higher levels of government will need to come into play to counteract the local political power of homeowners. Some state governments have made efforts to limit the power of locals to restrict the housing supply. California recently passed a law, SB9, preventing munici-

palities from blocking small accessory dwelling units. The new units enabled by this measure will be a small drop in the bucket of the state’s notoriously limited housing supply, but it works in the right direction.
The federal government, perhaps, could have a similar role in scaling back the power of locals. While some local control over a neighborhood is desirable, perhaps locals do not need the authority to limit the height of buildings. Perhaps they should be allowed to separate uses if they so choose, but without blocking increases in overall density. When considering the economy as a whole, such restrictions seem unhelpful and counterproductive in maximizing welfare. Reforms of this nature – scaling back local power where it does most harm –may be a part of the solution.
With greater public awareness and regulatory reform, the US may be
able to make housing more plentiful and affordable. While many other factors impact housing prices besides regulatory supply constraints, it is important to understand the incentive structures our policies create, so that we can predict their logical outcomes. Ultimately, the key challenge is to create a policy regime that can effectively address externalities without limiting the dynamism of urban real estate markets.
1989 Assembly Bill 435: Wisconsin Act 222: An Act to renumber 16.94; and to create 16.842 of the statutes, relating to: state capitol view preservation. § (1990).
Advisory Committee on City Planning and Zoning, A Standard State
Zoning Enabling Act: Under which municipalities may adopt zoning regulations § (1926).
Badger, Emily, and Quoctrung Bui. “Cities Start to Question an American Ideal: A House with a Yard on Every Lot.” The New York Times. The New York Times, June 18, 2019.
Bertaud, Alain. “Order without Design: How Markets Shape Cities.” The MIT Press, 2018. Fischel, William A. “An Economic History of Zoning and a Cure for Its Exclusionary Effects.” Urban Studies 41, no. 2 (2004): 317–40.
Fischel, William A. “Zoning Rules!: The Economics of Land Use Regulation.” Lincoln Institute of Land Policy, 2015.
Glaeser, Edward L. “Triumph of the City: How Our Greatest Invention Makes Us Richer, Smarter, Greener, Healthier and Happier.” Penguin Press, 2012.
Glaeser, Edward L., and David Cutler. “Survival of the City: The Future of Urban Life in an Age of Isolation.” Penguin Press, 2021.
Gyourko, Joe, and Jacob Krimmel. “The Impact of Local Residential Land Use Restrictions on Land Values across and within Single Family Housing Markets.” Journal of Urban Economics 126 (2021): 103374.
Hermann, Alexander. “Price-to-Income Ratios Are Nearing Historic Highs.” Joint Center for Housing Studies: Housing Perspectives. Harvard Joint Center for Housing Studies, September 13, 2018.
Hsieh, Chang-Tai, and Enrico Moretti. “Housing Constraints and Spatial Misallocation.”American Economic Journal: Macroeconomics 11, no. 2 (April 2019): 1–39.
Sechopoulos, Stella. “Most in the U.S. Say Young Adults Today Face More Challenges than Their Parents’ Generation in Some Key Areas.” Pew Research Center, February 28, 2022.
The Urban Institute. “Too Far from Jobs: Spatial Mismatch and Hourly Workers.” February 21, 2019.
Wisconsinites for Inclusion and Diversity in Economics (WIDE) was founded in 2018 and works to ensure all PhD Candidates in Economics at UW-Madison reach their full potential. To achieve our goal, we tackle barriers that disproportionately hinder the full participation and success of students from groups who’ve faced historic exclusion or under-representation in economics. We direct our programming towards students in identity groups such as women, non-white students, and LGBTQ+ individuals, and we hope that students from a wide spectrum of backgrounds can benefit from our work. Our co-presidents, Nisha Chikhale and Katherine Kwok, lead a team of PhD students who are passionate about WIDE’s mission and want to lend their talents to its success. Our programming and initiatives are centered around community building, professional
development, departmental advocacy, and outreach and service.
Although we primarily engage with the UW-Madison Economics PhD and undergraduate community, WIDE’s work is a response to the broader issues of diversity, equity, and inclusion in the field of Economics. As of 2018, only 27% of PhD Economists in academia and 30% in government roles are women. PhD Economists who are Black, Hispanic, Asian, Native American or Pacific Islanders, American Indian or Alaskan Natives, or multiracial make up 19% of all PhD Economists in academia and 26% in government roles (Wessel et al., 2021). In addition to the underrepresentation of women and racial/ethnic minorities, recent studies have also documented the lack of socioeconomic diversity among PhD economists (Stansbury and Scultz, 2022).

Committing to the full participation and success of groups who have faced exclusion or been historically underrepresented in economics includes expanding access at the application stage. The process of applying to economics PhD programs is often opaque and difficult to navigate. This systematically disadvantages underrepresented minority students, who typically have less preexisting knowledge of the field and fewer personal connections to established PhD economists. In addition to our efforts to support current UW-Madison PhD students and improve department inclusivity, WIDE is committed to diversifying the economics pipeline and eagerly engages with undergraduate students. To that end, we have organized panel discussions and workshops for UW-Madison undergraduates over the past few years to share information about economics PhD
programs, applications, and ways to prepare.
Last Fall, WIDE collaborated with Women in Economics to host a PhD Student Panel and Social Hour. The panel covered topics like motivations for an Economics PhD, ways to prepare for and apply to graduate programs, possible research topics and career trajectories, and more. The social hour following the panel provided an opportunity for PhD students and undergraduate students to engage more casually over snacks and coffee. More recently in Spring 2023, WIDE hosted a Lunch Workshop that offered tracks for Exploring Econ Research and Applying for Econ PhD Programs. This event included opportunities to engage with peers similarly interested in continuing work in economics, get advice from PhD students, work with the Career and Advising staff, and talk to the De-
partment Chair, Chris Taber. If you have not attended one of the WIDE events yet, keep your eyes peeled and attend the next one! In the meantime, the WIDE Team has compiled a list of their top tips for applying to PhD programs in economics:
A. Highlight your research potential.
A key aspect of any economics PhD application is demonstrating your interest and potential for research. This could look different for everyone, but it often means building up research experience during and after your time as an undergrad, through research papers and thesis projects, as well as part-time and full-time research assistantships. It has become increasingly common for students to spend around two years working full-time as research assistants or predoctoral fellows before enrolling in PhD programs. While this does extend the time it takes for you to complete a PhD,
pursuing research before graduate school gives you a chance to strengthen your research skills and sharpen your interests. This could be a good option if you are unsure about jumping directly into graduate school after undergrad, and want to experience what conducting economic research is like on a day-to-day basis.
B. Emphasize your quantitative and technical skills.
Getting a PhD in economics is very math-intensive. By demonstrating that you have taken high-level math classes such as real analysis or probability theory, you can show that you are prepared for the quantitative rigor that is needed to be successful in PhD classes. Getting a PhD in economics also requires strong coding skills in languages such as Stata, Python, Julia, and Matlab since our research involves a lot
of data analysis and estimating mathematical models of our world. Taking classes where you learn to code or learning to code through a research assistant position is a great way to show that you are equipped with the technical skills needed to be a good economics researcher.
Unlike applying to undergraduate programs from high school, you can expect the people reading your letters of recommendations to possibly know the people who write these letters. The world of economics is small. If your letter writers are publishing research, it is likely that the admissions committees (made up of economists who also do research) know your recommender and their work! This means it can be strategic to leverage networks and optimize your application strategy in a way that was not possible in your undergraduate applications.
Economics PhD programs will frequently receive hundreds of applications from well-qualified prospective students each admissions cycle, and they can only admit a handful of students in each cohort. This means that even though you may be a very strong applicant, it is extremely competitive to get into an economics PhD program. Students typically apply
to 15-20 PhD programs to increase their chances of admission. Keep an open mind when applying to programs and consider applying to a few reach schools, a few target schools, and a few safety schools.
“What originally drew me to EQ was the fact that this club was a fantastic opportunity for students to have their perspective and opinion heard on a wide range of economic topics. The wealth of insightful articles and discussions that have appeared in Equilibrium over the years has inspired me, and I’m proud that this journal has housed so many outstanding works. Although my time as editor may be nearly complete, it feels good to leave this journal at a point where we have so many colorful and dedicated contributors. I will keep reading our editions once I graduate and am excited to see where Equilibrium ends up in the coming years because I am confident that, wherever I may be, Equilibrium will prosper.
Stansbury, Anna, and Robert Schultz. “Socioeconomic Diversity of Economics PhDs.” Peterson Institute for International Economics Working Paper 22-4. 2022.
Wessel, David, Lorena Hernandez Barcena, and Nasiha Salwati. Gender and Racial Diversity of Federal Government Economists: 2020 Data. Washington, D.C.: Hutchins Center on Fiscal and Monetary Policy, The Brookings Institution. 2021.
–Matthew Watiker ’23, Economics and Computer Sciences. Vol.13 Editor-in-Chief, Vol.12 Outreach Director, Vol.11 Contributing Writer.“
I loved being a member of EQ and I’m kinda sad I didn’t join earlier in my undergrad. I’ve always wanted to get published and get more research experience and EQ pushed me to go beyond the classroom and apply economic concepts to real-life situations. For anyone wondering whether they should join or not- do it! It’s a great opportunity and it can even help you in your professional career. For example, I added EQ to my resume, and everyone I had an interview with asked me about it and was very impressed. Be different, share your ideas, and leave a mark on the Econ department!
–Alexandra Dogaru ’23, Economics, Accounting, and Finance. Vol.12 & 13 Contributing WriterI really love the three years I spent at Equilibrium. I joined as a sophomore interested in research but didn’t know how to do it, and Equilibrium helped me grow and equipped me with the ability to do independent research. Here you can pursue your purest academic interest with a bunch of friends who share the same will and ambition with you, and you can publish your work for the whole university to read! I especially encourage international students and new students to join– here you can enjoy a diverse, welcoming, and helpful atmosphere, and I would say it greatly helped me in planning my economics career and building my dedication to my current research topic. Join now and you will never regret it!
–Novak He ’23, Economics (Honors), Sociology, and Data Sciences. Vol. 11, 12 & 13 Contributing Writer40
A divided government is when the House of Representatives, the Senate, and the White House are controlled by different parties. A commonly-held belief among those interested in economics is that a divided government is better for the economy. Proponents of this theory argue that when Congress and the White House are forced to compromise, less legislation gets passed. What does get passed is milder policy that lets the free market take its course, ultimately resulting in a better economy. Debates around the impact of a divided government as opposed to a unified government often resurface when the control of a branch of government switches hands, or when the economy is seemingly in a precarious place. With the Republicans narrowly winning control of the House of Representatives in the November 2022 midterm elections, unified Democratic control of the federal government ended, and debate around this theory emerged once again. I decided to see if a divided government could actually allow statistically-based predictions of a better-performing economy, or if this theory was just a lot of hot air.
Views on unified vs. divided government differ across the political spectrum. In an opinion piece for CNN, Moody’s Analytics Chief Economist Mark Zandi boldly proclaimed, “A divided government will be disastrous for the US economy.” Zandi argued that a divided government would hamper the abilities of the federal government to swiftly and effectively respond to economic crises. Ahead of the 2022 midterms, tech mogul Elon Musk urged American voters to vote Republican, arguing that “shared power curbs the worst excesses of both parties.” This line of thinking tends to be especially popular among advocates of small-government, like the Cato Institute, a libertarian think tank in Washington. The Cato Institute argues that, in recent decades, government spending as a percentage of GDP has shrunk when the government is divided. “A divided government is a necessary but not sufficient condition for government ‘shrinkage’” argues Professor Steven Hanke of Johns Hopkins University for the think tank. Hanke’s most extrapolated example of this is the six year period of divided government in the Clinton era
(1995-2000) when Hanke argues that the combination of a post Cold-War military drawdown and the Clinton administration compromising with the Republican Congress led to balanced budgets and prolonged economic growth. While the late 1990s in particular were a boom era for America, Hanke did not emphasize if this era was an exception or the rule that divided government is good for the economy.
With widely differing views, I decided that statistics and data would be a better place to turn to for answers than news organizations with unofficial partisan affiliations or think tanks with an ideological bent. To do so, I decided to focus on two of the most popular metrics for economic growth: the annual real GDP (RGDP) growth and the annual growth of the Dow Jones Indus-
government, when compared to years with divided government. If anything, it seems like the economy has historically done better under unified government, not divided government.
trial Average (DJIA)—a popular equity index of 30 prominent companies often used as a benchmark for stock market performance.
I chose the DJIA over other metrics like the S&P 500 because the DJIA is older and contains data from the beginning of the postwar era. I compiled data from 1945 through 2021, using the end of World War II as a rough benchmark for the emergence of the modern American economy. Then, I separated the data into two groups: one of years where the federal government was divided, and one of years where it was unified. Interestingly, the average RGDP growth in years with unified government was 3.07%, while in years with divided government, it was only 2.66%. Similarly, the average DJIA growth in years with unified government was 9.34%, while in years with divided government, it was only 7.95%. This meant that on average, RGDP growth was 14.31% higher and DJIA growth was 16.08% higher in years with unified
However, I was still skeptical if there was actually a connection between divided government and economic performance. I ran regressions of RGDP growth and DJIA growth on a dummy variable where the variable is equal to 1 if the government was divided and 0 if the government was unified, throughout 1945 to 2021. The coefficients for each variable were negative, possibly suggesting worse economic performance with a divided government, but neither was statistically significant.

But in Congress, which party controls which legislative chamber isn’t the whole story. For example, in the previous congress, though Democrats held a trifecta, large pieces of legislation (like President Biden’s Build Back Better Agenda) were trimmed down or scrapped. This was largely due to a 50-50 Senate and a narrow House majority, which essentially allowed any one senator or a few representatives from the Democratic caucus to halt legislation which may have helped or stymied indicators of economic growth. Inspired by this recent history, I decided to see if there was any correlation between the size of legislative majorities in Congress and RGDP and DJIA growth. Using data from Congressional records, I deter-

mined the percentage size of each party’s majority in each year. Once again, I separated the data into years of divided government and unified government, and then determined if there were any significant correlations between the size of a party’s majority for each legislative chamber and RGDP and DJIA growth in that given year. For finding any correlation between majority size, there were notable correlation coefficients of -0.29 for Senate majority size in unified government and DJIA growth, and -0.42 for House majority size in unified government and DJIA growth, suggesting moderate levels of negative correlation.
However, this moderate correlation does not mean that the stock market in general performs worse in years when voters give one party a lot of power because one party has such a strong grip on power at the federal level. In 1966, Democrats held the presidency and held supermajorities in both chambers of Congress. The DJIA also dropped over 18 points. As Yahoo News notes in a republishing of an article from zacks.com, “the Vietnam War was escalating, inflation was rampant, interest rates were surging, and concerns over a global recession pounded stocks.” Especially compared with high inflation and stock market troubles around December and January, this situation may seem familiar. It seems more likely that these massive external factors, combined with the general

social unrest the United States faced during this time, contributed more to upheaval in the stock market than simply a Democratic supermajority. In fact, a paper from the National Bureau of Economic Research (Snowberg, 2006) concluded that “the majority party in Congress has relatively little control over economic policy, at least as it affects equity, bond, oil and currency prices,” meaning that even a congressional supermajority can’t do that much, compared to an institution like the Federal Reserve. Additionally, whatever Congress does might not immediately impact the economy, as policies can have delayed effects, or contain provisions that take effect years later.
Similarly, though Hanke in his piece for the Cato Institute analyzed the economic boom in the 1990s, he neglected to mention the Internet Revolution of the 1990s across the U.S., which opened up whole new sectors of the economy and vastly transformed existing ones to function in a new digital age. In the early 1990s, the internet was only available to governments and universities, and by 2000, most households had internet. The economic impact of such a massive shift seems likely to have influenced the economic boom of the 1990s when compared to Speaker Newt Gingrich and President Clinton having to compromise on budgetary negotiations (though that could have helped!)
Ultimately, America’s economic condition measured by RGDP and DJIA growth in post-war years can’t be attributed too much to who controls what branch of government and how large a majority they have, especially in our relatively– free market society. Instead, for predictions on future economic growth, analysts could look more at macro-trends from the past and those that are ongoing. These include demographic growth, women entering the workforce, America’s deindustrialization and the subsequent rise of the technology industry, climate change, and the artificial intelligence revolution, rather than the ever-changing control and makeup of Congress. As for the next congressional cycle, those who would like to predict how the American economy will fare are better off watching for other key economic leading indicators rather than anticipating how the

economy will fare based on the newly divided federal government.
“Party Division.” U.S. Senate: Party Division, United States Senate, 9 Dec. 2022.
Cox, Chelsey, and Courtney Subramanian. “‘Starting from Scratch’? Which Parts of Biden’s Social Spending Plan Can Survive, Which Will Get Scrapped.” USA Today, USA Today, 21 Jan. 2022.
“Dow Jones - DJIA - 100 Year Historical Chart.” MacroTrends. net, MacroTrends, 15 Dec. 2022.
Hanke, Steven H. “Govern ment Works Better When Divided.” Cato.org, The Cato Institute, 23 Nov. 2018.
Hayes, Brian. “A Blast from the Past: The 1966 Case.” Yahoo News, Yahoo!, 28 Dec. 2022.

Houston, Chris. “Party Control of the U.S. Senate and House of Representatives (Including President’s Party): 1855-2023.
Krugman, Paul. “Is Divided Government Good? Don’t Take Elon’s Word for It.” The New York Times, The New York Times, 8 Nov. 2022.
“National Income and Product Accounts.” BEA Interactive Data Application, Bureau of Economic Analysis, 30 Nov. 2022.
“Party Divisions of the House of Representatives, 1789 to Present: US House of Representatives: History, Art & Archives.”
Party Divisions | US House of Representatives: History, Art & Archives, United States House of Representatives, 15 Dec. 2022.
Snowberg, Erik, et al. “Party Influence in Congress and the Economy.” NBER Working Paper Series, no. 12751, Dec. 2006.
Zandi, Mark. “Opinion: A Divided Government Will Be Disastrous for the US Economy.” CNN, Cable News Network, 17 Nov. 2022.
On February 24, 2022 Russia launched a full-scale invasion of Ukraine. This invasion came as no surprise to the rest of the world. Russia had been building up an army of around 190,000 soldiers at the borders of Ukraine[1]. Why is Russia doing this? While Putin claimed he needs to protect oppressed Russians in Ukraine, the likely motivation is that the invasion serves as a means for Putin to stretch his empire and attempt to regain a military advantage over NATO. Since February 24th, there have been over 100,000 casualties on both sides and 7,000 civilian deaths as well[2].
Much of the western world is in support of Ukraine, assisting the underdog nation in various ways without directly putting troops on the ground. Ukraine has received billions of dollars from 28 countries, including 13 billion from the United States[3]. Also, many countries have imposed economic sanctions on Russia. These sanctions serve to cripple their economy by restricting the transfer of goods and assets—isolating their economy from much of the world. Fast forward to the start of 2023, what was initially intended as a swift takeover of Ukraine is now
a slow and deadly battle of attrition.
Alongside mounting casualties, this battle has serious economic consequences, not only for Russia and Ukraine but also on a global scale. Putin’s attempt to bring Russia back to its former glory may succeed to some extent today, but this is a conflict, ultimately, with no winners.
Prior to the war, Russia was a strong player in the world economy– it held the eleventh-highest GDP in 2021[4]. Their economy isn’t as balanced as many other strong economic nations, the main driver of their economy is the energy industry and they are very reliant on their
Sanctions are measures taken by a government or international organization to restrict trade or economic activity with a country or individual, usually as a means of exerting political or economic pressure. The barrage of sanctions against Russia were unprecedented in their scale and included things like trade restrictions, asset freezes, and travel bans. This caused the Russian economy to fall into a chaotic downward spiral, emphasized by the depreciation of the ruble by nearly 30% in the two weeks following the invasion[7].
Germany, a country that primarily relied on Russian gas before the war, the average price of gas for a single-family home increased from 7.06 euro cents per kilowatt hour in 2021 to 20.04 as of Q4 2022. To quantify this, this increase has caused the average single family home gas bill in Germnay to rise from €1,260 to €4,000 from 2021 to 2022[8].
natural resources. Russia is the second largest exporter of crude oil in the world and accounts for 40% of Europe’s gas[5]. Their economy was growing at a healthy pace, projected to grow about 3-4 percent the year prior to the invasion[6]. Their economy was in a good place, heavily integrated with the global economy through investment and trade. Today, the economic landscape in Russia looks much different. The western world is waging an economic war against Russia, essentially denying them the economic benefits of international trade. The weapon of this economic war is sanctions.
After the initial round of sanctions took place, Putin’s counterattack was to halt energy supplies to Europe. With many of these countries heavily relying on Russian energy, this economic attack had the potential to spur an energy crisis in Europe. The hope for Russia was that a harsh winter would cause some European countries to feel the consequences of the rough energy market. Unfortunately for Russia, this has been so far, one of the warmest winters recorded in the past two centuries. Also, the energy market wasn’t as bad as anticipated since many countries ended up gathering large stockpiles of energy from other countries. This is not to say there wasn’t a negative impact, just to the extent that Russia hoped. People across Europe have been negatively affected by the instability of certain markets, more so in countries that were more economically intertwined with Russia. In
Meanwhile, the cost of the war has continued to be a massive burden on the Russian economy. Putin has allocated 116 billion dollars to defense in 2023– 30% of their budget for the year[9]. For now, Russia can continue to fund this war. But there are some problems that go beyond pure currency. With Russia’s limited trade partners, they are currently dealing with serious shortages that could hurt their ability to effectively fight the war. While they still have one major trading partner, China, many


Chinese computer chips Russia has received have been defective[10]. This has caused them to resort to taking apart planes and other electronics for parts to help continue to manufacture for the war[11]. Putin has also stated recently in a televised meeting with government officials that shortages in pharmaceutical drugs become a concern[12]. Looking past physical goods, another concern for Russia is the loss of workers in the labor force. It has been widely reported that around 700,000 Russians have fled the country in the past year, a proportion of whom are educated men of military age[13]. Around 300,000 Russian men have been pulled from the labor force to fight in the war. This is a substantial number of people to lose considering Russia’s labor force of 75 million[14]. This will continue to slow the Russian economy as this number inevitably grows due to the increased demand for soldiers.
Chinese businesses are refusing to do deals for fear of facing public backlash. As a consequence, Russia has been relying on fewer manufacturers for some vital goods. Outlets have reported that up to 40% of the
Russia and Ukraine are not the only countries being hurt financially by the war. This conflict has forced many nations to adjust the fundamental functions of their supply chains. Besides the energy sector, one area where countries have had to adjust is the food supply. Ukraine is often referred to as the “breadbasket of Europe” for its large role in the world’s wheat production. Russia and Ukraine alone account for about a third of the world’s wheat supply and 75% of the world’s sunflower oil
supply[15]. This has obviously been disrupted by the war, and we have seen increases in food prices and food shortages throughout Europe and Africa. There have also been major disruptions in the supply chain routes between Europe and Asia due to stalled train routes. Overall, the war has jolted the global market with chaos and instability.
How do Russians feel about the war? It’s unclear. The number of people in Russia who allegedly support the war varies dramatically depending on where you look. While many Russians have been negatively affected by the war, it’s important to recognize that the true victims are the Ukrainians. The country is continuing to be decimated as Russia pushes further into the battle. With over 7,000 recorded civilian deaths, this is not a war being fought with any civilian compassion[2]. According to data gathered by the United Nations High Commissioner for Refugees, eight million people have fled Ukraine into Europe[16]. This accounts for roughly 19% of their total population. The good news for Ukraine is that they are doing much better than anticipated. This is largely due to a combination of poor planning from Russia on the initial invasion and foreign aid from the United States and the European Union. There are even many who speculated that Russia will end up losing this war. Though, with a potential Ukraine victory in preventing a full takeover,
they will still have an incredible amount of recovery to do.
Looking back at Russia, they are certainly paying the price for this invasion. Not only are they fighting Ukraine, but in a sense, they are also at war with the United States and EU, at least financially. As long as foreign countries are willing to invest money to prevent the spread of the Russian empire, Putin will continue to be forced to prioritize the invasion over the country’s economic well-being. As some project the global economy to lose 2.8 trillion dollars by the end of 2023, this war is having financial repercussions across the globe[17]. As this conflict continues with no end in near sight, the long term economic and humanitarian impact remains uncertain. ______
Brown, By David. “Ukraine Conflict: Where Are Russia’s Troops?” BBC News, February 23, 2022.
Nagorski, Tom, Mariana Labbate, and Anna Deen. “Ukraine War in Data: A Year of Casualties, Violence and Displaced Ukrainians.” Grid News, February 24, 2023.
U.S. Department of Defense. “U.S. Announces $2.98 Billion in Aid to Ukraine,” n.d.
“World GDP Ranking 2021StatisticsTimes.Com,” n.d.
Palumbo, By Jake Horton & Daniele. “Russia Sanctions: What Impact Have They Had on Its Oil and Gas Exports?” BBC News, January 26, 2023.
Prokopenko, Alexandra. “The Cost of War: Russian Economy Faces a Decade of Regress.” Carnegie Endowment for International Peace, December 19, 2022.
Tan, Weizhen, and Natasha Turak. “Russian Ruble Plunges Nearly 30% against the Dollar amid Sanctions over Ukraine Invasion.” CNBC, February 28, 2022.

Corbeau, Anne-Sophie, Ann-Kathrin Merz. “Understanding Germany’s Gas Price Brake: Balancing Fast Relief and Complex Politics.” Center on Global Energy Policy at Columbia University, SIPA, February 7, 2023.
Quadri, Sami. “Vladimir Putin ‘Allocating over 30% of Entire Budget on Defence’ as Cost of Ukraine War Weighs on Russia.” Evening Standard, December 11, 2022.
Shen, Xinmei. “Defect Rate of Chinese Chips Shipped to Russia Surged to 40 per Cent after Western Sanctions, Local Newspaper Says.” South China Morning Post, October 20, 2022.
Reuters. “Exclusive: Russia Starts Stripping Jetliners for Parts as Sanctions Bite,” August 9, 2022.
Reuters. “Russia’s Putin Says Stockpile Needed to Curb Drug Shortages,” January 24, 2023. The Kyiv Independent news desk. “Forbes Russia: 700,000 People Have Left Russia since Mobilization Began.” The Kyiv Independent, October 4, 2022.
Statista. “Topic: Employment in Russia,” March 3, 2023.
Jazeera, Al. “How Did the Russia-Ukraine War Trigger a Global Food Crisis?” Explainer News | Al Jazeera, June 20, 2022.
United Nations High Commissioner for Refugees. “UNHCR: One Year after the Russian Invasion, Insecurity Clouds Return Intentions of Displaced Ukrainians.” UNHCR, n.d.
Hannon, Paul. “Russia’s War in Ukraine to Cost Global Economy $2.8 Trillion, OECD Says.” The Wall Street Journal, September 26, 2022.
For economists, healthcare, besides education, is one of the best indicators of the quality of human capital (Alvi, 2014). Increasing the quality of human capital improves productivity, spurs innovation, and pilots economic growth. Healthy people are considered happier and more productive, and happier individuals are more motivated to contribute to positive economic growth (Rhaghupathi, 2020). According to the World Bank, in 2019 the US spent around 17.77% of its GDP on healthcare, which at the time was around $3.8 trillion. The COVID pandemic has only inflated these values, and healthcare spending has increased to 18.3% of GDP valued at around $4.3 trillion in 2021 according to the Centers for Medicare and Medicaid Services. Being such a large and important industry, it is paramount that the US allocates funding and promotes intelligent personal spending in the most efficient way possible.
You don’t need to be the sharpest scalpel in the hospital(get it?) to also see that healthcare is an incredibly polarized and politicized issue. One only needs to think of loaded terms such as “social-
ized medicine” to describe universal healthcare, Trump’s priority to reform or repeal the Patient Protection and Affordable Care Act, or the push for “Medicare for All”. Even the general sentiment on healthcare in America is hard to contextualize as
care in 2019 while other developed OECD countries spent an average of 8.8%, the US has the lowest life expectancy, the highest rate of avoidable death, and other negative healthcare outcomes?
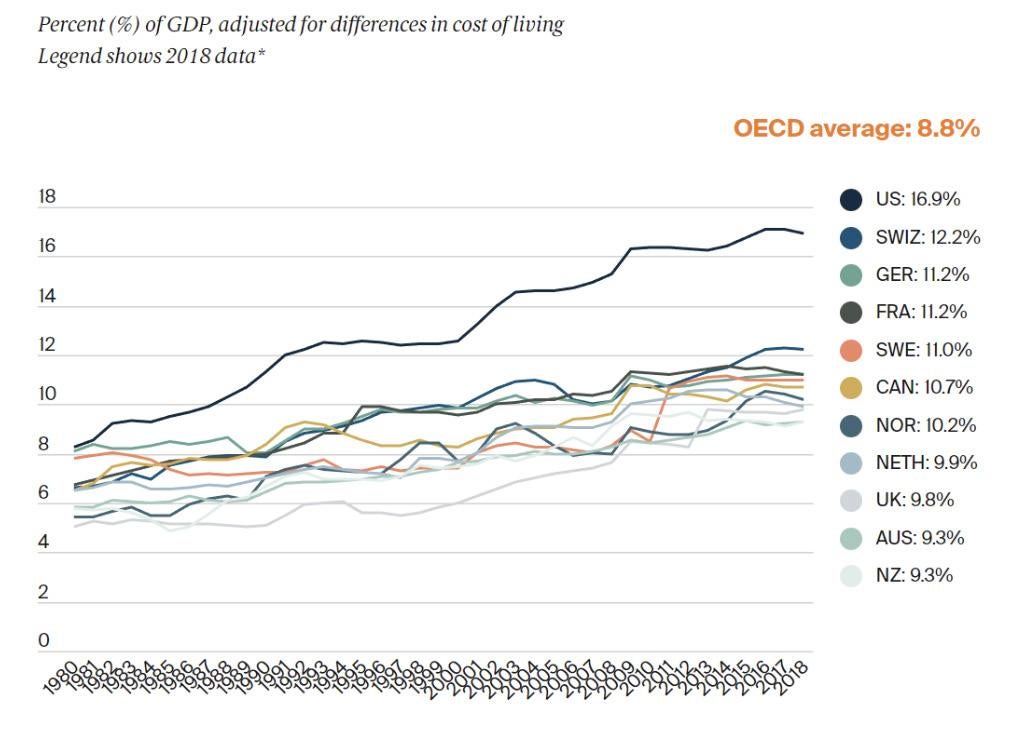
The European Journal of Health Economics from a specific perspective: voluntary health insurance. Through searching for an answer, hopefully it will become apparent that we can find our way to a happier and healthier future through the promotion of a stronger social insurance system.
the results are highly dependent on polling style. Meanwhile, data from the World Bank suggests costs are rising and our healthcare outcomes are lagging behind other developed countries. Even though the US excels in preventative medical measures, why is it that, given that the US spent 17.77% of its GDP on health-
There are many differences between the healthcare systems in the US and other comparable developed OECD countries, but this article mainly focuses on answering this question using research published on February 6, 2022 by a group of researchers from Babes-Bolyai University in
Voluntary health insurance (VHI) is a type of health insurance that is fully or considerably financed by employer-sponsored private health premiums. Often confused for Medicare and Medicaid, VHI commonly looks like an employer self-insuring health benefits for employees. For instance, when you get a job, your employer will often offer you a health insurance plan that is significantly cheaper than purchasing one yourself. There are two main types of VHI: supplementary and complementary. Benefits of supplementary VHI typically include better or faster quality of care, usually through private providers. On the other hand, complementary VHI provides additional coverage not provided under public plans, such as dental and eye care, physiotherapy, etc. Specific supplementary and complementary plans vary from country to country and aren’t set in stone, but follow these general definitions.
The researchers of “Does voluntary health insurance improve health and longevity?” investigate the effects of VHI on health and longevity in 26 countries in
Europe, split into four main groups based on health status indicators using a fairly recently developed dynamic panel threshold methodology. These indicators included various estimators clumped into four standardized components that then determined the group the country would belong to via cluster analysis. Indicators included health and longevity, financing and lack of corruption, alcohol and vegetable consumption with work stress levels, and the prevalence of VHI. Three of the four country groups were geographically homogenous, while the fourth (group 2 from below) was relatively balanced with moderate values for all factors.

Health and longevity are split into two categories: DALY and life expectancy, which were used as dependent variables whereas the other variables in the three components were used as independent variables. DALY, or disability adjusted life year, is a novel
and comprehensive indicator commonly used in related modern literature. DALY represents the loss of living a shorter life with disease compared to living a longer one without disease. DALY mainly helps identify allocative inefficiencies and yields proper resource reallocation afterwards. Using dynamic panel threshold methodology, researchers ran a regression analysis on the variables listed above using data offered by the World Health Organization, World Development Indicators, and Worldwide Governance Indicators from the World Bank, OECD, Eurostat, and the International Monetary Fund from 2000 to 2017. VHI was found to be a significant, positive determinant on health (DALY) and longevity (life expectancy), with the relationship being a threshold effect of the share of VHI in the total healthcare
industry (VHISHARE). The estimated threshold value was 6.3% where the percentage of VHISHARE below said threshold had the strongest effect on health and longevity when moving up towards the threshold (Dragos, 2022).
Logically, these results also make sense. It seems almost intuitive that a decent amount of VHI is beneficial, at least in a partially public health care system. Having access to a cheaper private option that could provide better care would benefit society to some extent, and, according to this study in Europe, going up to 6.3% of the healthcare market cap seems to be most optimal. It also makes sense that this is more related to supplementary VHI than complementary VHI. Complementary VHI varies greatly by country, but it typically fills gaps in publicly funded coverage. Regarding
supplementary VHI, there are a couple of plausible reasons why it is not very beneficial past a certain threshold and why it is significantly beneficial below. When the VHI share is low, it can indicate that those who would buy such packages would do so out of the need for important medical issues, while when the VHI share is high, if there is already a comprehensive public option the effect of VHI won’t be as great. Regardless, it seems that increasing the share of VHI in national healthcare markets to at least a 6.3% threshold in European countries could lead to significant increases in health and longevity.
Indeed, there are many differences between the US and European healthcare systems. Healthcare coverage in Europe is largely universal with most countries having a small set of heavily regulated competing private insurance providers where
all citizens have access to publicly funded insurance. In addition, our private share of healthcare expenditure is nearly eight times larger per capita than that of any OECD nation. This contributes to the observation that the US spends nearly two times as much on healthcare per capita as other countries and has similar, if not arguably worse, health outcomes while being mostly funded by the private sector.

This, at the very least suggests that a possible significant improvement exists in our healthcare system. VHI and its characteristics in the US might point us to a possible solution. VHI seems trustworthy, as it provides a cheaper and more reliable alternative here in the US until you realize that you lose your health insurance simultaneously when you lose jobs. Considering notoriously high private health insurance prices and the limited public option, this can greatly limit access to medical services based on personal finances for the uninsured. Relatedly, heavy VHI prevalence likely favors the higher-income segments of the population, who typically support market liberalization and deregulation of the private sector, which in a for-profit private healthcare system, would likely lead to rising prices.
There are a lot of other things that affect health and lifestyles, some of which are harder to measure than others. Culture, food quality,
and other social processes differ from country to country, and especially from the US to Europe, which might push healthcare costs upward in the long run. In addition, according to the OECD, the US leads the world in medical research and development spending, and the resulting need to recoup costs might trickle down into healthcare expenses. These arguments might be partly intuitive, but it’s hard to believe that they would account for such significant differences in price and outcomes between the US and Europe.
Given that the financial cost of our system here is so much greater than that of Europe, it would be wise to assume our healthcare system has much room to improve since our outcomes are at best equal. You don’t need to go very far in social media to see complaints of high healthcare expenditures or jokes related to ambulances, surgeries, and even birthing costs. Research results from European countries suggest that having lower VHI shares with a strong backbone of public healthcare infrastructure significantly improves general health outcomes while keeping the per capita cost considerably cheaper than the private infrastructure of the US. This suggests expanding the availability and effectiveness of Medicaid by increasing reimbursement rates for providers who treat patients under Medicaid. Enhancing the Affordable Care Act by smoothing the net income cutoffs for advanced premium tax
credits would also be a great step forward. Tailoring the US healthcare system towards that direction would be a smart decision and would allow crucial healthcare services to not be directly tied to the status of your job that would lead to better health outcomes for US citizens.
______
Alvi, Syed Ali Asjad, and Ahmed M. Ahmed. “Analyzing the Impact of Health and Education on Total Factor Productivity: A Panel Data Approach.” Indian Economic Review 49, no. 1 (2014): 109-123.
Chalise, Lekhnath. “How have healthcare expenditures changed? Evidence from the Consumer Expenditure Surveys: Beyond the Numbers: U.S.” Bureau of Labor Statistics, 2020.
Dragos, Sorin Liviu, Camelia Mare, Cristian Marius Dragos, Gabriela Mihaela Muresan, and Andrei-Alexandru Purcel. “Does Voluntary Health Insurance Improve Health And Longevity? Evidence From European Oecd Countries.” The European Journal of Health Economics 23, no. 8 (2022): 1397–1411.
Martin, Anne B., Micah Hartman, David Lassman, and Aaron Catlin.
“National Health Care Spending In 2019: Steady Growth For The Fourth Consecutive Year.” Health Affairs 40, no. 1 (2021): 14-24.
Raghupathi, Wullianallur, and Viju Raghupathi. “Healthcare Expenditure and Economic Performance: Insights From the United States Data.” Frontiers in Public Health 8 (2020): 262.
ST. LOUIS FED. “Real Median Personal Income in the United States.”(2021).
Sagan, Anna, and Sarah Thomson. “Why do people buy VHI?” Nih.gov; European Observatory on Health Systems and Policies(2016).
U.S. Health Care from a Global Perspective, 2019: Higher Spending, Worse Outcomes? Commonwealthfund.org(2020).
“Politicization of Health Care Preventing Real Changes to OutOf-Control System, Researchers Suggest.” John Hopkins Medicine(2013).
“QuickFacts: United States.” Census Bureau QuickFacts; United States Census Bureau(2022). Current health expenditure (% of GDP)(2022).
World Bank.NHE Fact Sheet. (2021). CMS.
World Bank Open Data. (2023). World Bank.
– First and Third image courtesy of the Commonwealth Fund –– Second image courtesy of the Dragos (2022) .
Fuxian Yi is a famous scholar on the population issue of China. He has initiated and launched a campaign against China’s one-child policy since 2000, leading to its repeal in 2016. Dr. Yi is now a Senior Scientist in the Department of Obstetrics and Gynecology at UW-Madison. We are excited to have the opportunity to interview Dr. Yi and listen to what he has to say about China’s demographic crisis.

Q: Why did you choose to study the population issue? How did you find out that the one-child policy was unnecessary?
A: As a child, I witnessed relatives being forced to have abortions, fleeing to avoid forced abortions, and having their houses demolished and livestock taken away by the government for illegally having a second child. My neighbor’s forcibly aborted baby was still alive, dumped in the trash, and secretly passed by the mother in the hospital room to the father outside the window, so the boy survived.
In 1988 I was admitted to Hunan Medical University, where I witnessed the brutality of forced abortion during my gynecology internship. In 1999, I joined a highly international laboratory at the University of Minnesota-Twin
Cities as a postdoctoral fellow. Talking to my colleagues from 17 countries, I felt China’s one-child policy was wrong. Even under policies encouraging childbearing, regions with cultures similar to China’s, such as Hong Kong, Taiwan, Singapore, South Korea, and Japan, have the world’s lowest fertility rates (children per woman).
Q: How did you initiate and launch a campaign against China’s one-child policy?
A: In 2000, I called on the Chinese authorities to end population control. The Chinese authorities strictly prohibited any criticism of the one-child policy, so I could only
In June 2004, I published an article entitled “What is China waiting for by not stopping population control?” on People’s Daily online. This article was posted on October 15, 2004, by International Herald Leader, an official newspaper under Xinhua News Agency. The People’s Daily selected it as an essential theory, marking the rise of anti-population control public thought in China. With the publication of this article, the door has since been opened to discussing China’s population policies. On November 1, 2004, China Economic Weekly, a subsidiary of the People’s Daily, published my article, “Who will take care of the elderly in China?” causing a stir.
Q: How did your book go from being the #1 banned book in China to the #1 best book?
A: From 2004 to 2006, I was invited to publish several long reports in Hong Kong Fax, an internal reference for China’s top leaders. My reports received the attention of some leaders. For example, the then Minister of Finance took five of my reports. I compiled my reports into a book entitled “A Big Country with an Empty Nest” published in 2007 by Hong Kong-based Strong Wind Press.
were searching for me, so I fled Nanjing overnight.
post articles on overseas Chinese websites. I tried unsuccessfully to get my article published on websites in mainland China. Later I adjusted my strategy to avoid direct criticism of the Chinese government in favor of an academic approach. Probably also because Chinese leaders have been reading my articles through internal channels since 2000, the forums of China’s official websites in 2003 occasionally allowed some of my articles to be posted. A single spark began to start a prairie fire! My supporters and I posted my article on non-government forums, which allowed discussion of my articles due to the links to the official forum.
As of the end of 2004, my articles had received tens of millions of online views, while others’ articles on the topic had received less than 100,000 total views. Thomas Scharping, Chair for Modern Chinese Studies at the University of Cologne, published a paper in the Journal of Contemporary China stating, “Yi Fuxian waged a veritable one-man crusade against the one-child policy”.
More and more people joined my campaign. Some of my single articles received millions, even tens of millions of online hits. I have been interviewed by hundreds of media outlets. For example, the New York Times, the Wall Street Journal, and the Washington Post published forty interviews with me.
However, two months later, all Chinese provinces, ministries, and China Central Television unusually received a circular letter from the central government to ban my book. At the same time, they were not notified in 2006 when eight prominent political books were banned. Therefore, my book was called “No.1 of banned books of 2007 in China”. But the online version was widely spread and received tens of millions of views online.
The local authorities portrayed me as a traitor and threatened to punish me severely if I returned. Therefore, I did not visit China during 1999-2009. When I visited China in 2010, I secretly attended the annual conference of the China Population Association at Nanjing, where one of the drafters of the 1980 one-child policy was criticizing me and my book at the invitation of the Minister of the National Family Planning Commission. Two hours later, I was told the police
IT TURNS OUT THAT MY PREDICTIONS ABOUT CHINA’S POPULATION WERE ACCURATE. SO, IN 2012, I WAS INVITED TO PUBLISH A 50,000-WORD REPORT ENTITLED “RETHINKING CHINA’S POPULATION POLICY” IN AN INTERNAL REFERENCE UNDER CHINA’S NATIONAL DEVELOPMENT AND REFORM COMMISSION, WHICH IS AVAILABLE ONLY TO A HANDFUL OF CHINA’S TOP LEADERS, INCLUDING THE PRESIDENT AND PREMIER.
In 2013, a new edition of my book was released by a publisher under the Chinese State Council and was picked as one of the ten best books by the official Xinhua News Agency and first among the “100 Best Books of 2013 in China” by China Publishing Today.
China scrapped its one-child policy in 2016, and I was invited to speak at the 2016 Bo’ao Forum for Asia with the Chinese Premier Li. In 2016, I told the New York
Times that China’s economy could not surpass that of the US due to its aging population and shrinking workforce, which angered the Chinese authorities, and I was officially blacklisted.
Q: Why are you jokingly called a “cross-boundary robbing bandit” from western Hunan?
A: I was born in western Hunan Province, isolated by the Snow Mountains, where people are known by the nickname “bandits from western Hunan”, meaning they tend to be skeptical of government policies and brave enough to challenge norms.
The untimely death of my sisterin-law inspired me to drop my focus on economics and enroll in a medical school. While at the University of Minnesota, as a result of studying the biological mechanisms of opioid addiction, my interest went beyond biomedical boundaries and into sociology.
In 2002, I joined the Department of Obstetrics and Gynecology at the University of Wisconsin-Madison as a scientist. Under Professor Ian Bird, our team studies maternal vascular adaptations to pregnancy. One of the longest and deepest traditions surrounding UW-Madison, the Wisconsin Idea signifies a general principle: that education should influence people’s lives beyond the boundaries of the classroom. Dr. Bird’s support for me beyond the lab
bench and disciplinary boundaries. I have introduced medicine into demographic research and medicine and demography into economics research.
Because I engage in interdisciplinary research that does not conform to existing academic norms, I am considered by every discipline to be an obnoxious invading bandit. But my estimates and projections of China’s population and economy have repeatedly proven to be more accurate than the official ones.
Q: That is to say, the Wisconsin Idea contributed to the abolition of China’s one-child policy?
A: Yes. Under the Idea, UW-Madison launched the “Discovery to Product (D2P)” initiative. I have applied this Idea to promote the adjustment of China’s population policy: Knowledge to Action (K2A) and Theory to Policy (T2P).
Over the years, I have received tens of thousands of requests for help from women facing forced abortions due to illegal pregnancies, and with my encouragement and advice, many fetuses have been saved.
I have distributed brochures and books to almost every member of the national parliament and provincial and ministerial officials in China. As a result, some parliamentarians submitted proposals to end the one-child policy, and some officials stopped tightening population control. For example, perhaps partly because of my open letter and a
paper, the head of Xinjiang Uygur Autonomous Region did not tighten population control during 2011-2016, avoiding the loss of one million births.
Chinese authorities issued hundreds of bans against me at the central and provincial levels (rare in Chinese history) but eventually had no choice but to adopt my advice in their policies. One of my papers was selected as one of 116 papers with the greatest impact on China’s policymaking from 1979 to 2018 and was the only one calling for adjustments in population policy.
Because my views help reduce strategic miscalculations, they have been widely cited by governments, congresses, and think tanks around the world, and I have been invited to speak at summits such as Canada-China Roundtable and Reuters Next.
Q: Can you explain why your estimates and projections of China’s population are more accurate than the official ones?
A: Some medical parameters, such as infant mortality, life expectancy at birth, contraceptive prevalence, and abortion rate, correlate linearly with the fertility rate. Age-related alterations in sex hormone levels, ovarian reserve, sperm concentration, and motility affect fertility rates. Some socio-economic changes eventually affect the fertility rate by changing
medical parameters, such as the improvement of education and urbanization will delay marriage and childbearing, thereby increasing the infertility rate and reducing the desire to have children. I have a much more solid academic background than Chinese officials and UN demographers. I applied reproductive pathology, medical psychology, behavioral medicine, and psychoanalysis to “diagnose” China’s population based on various medical and socio-economic indicators, which have proven more accurate than the official Chinese and UN ones.
For example, in my 2007 book, I predicted that China’s population would decline in 2017 under the one-child policy. Then, in 2019, I concluded that China’s population had already begun to decline in 2018 (one year later than my initial estimate due to the twochild policy), with a fertility rate of 1.1.
However, the National Population Development Strategy Research Group projected in 2006 that the fertility rate would stabilize at 1.8, and the population would decline in 2034. Similarly, the 2006 revision of the UN World Population Prospects (WPP) projected that China’s population would not begin to decline until 2033, with a fertility rate of 1.85 for 2020-2025.
China replaced the one-child policy with the two-child policy in 2016, when China’s State Council
predicted that China’s population would not decline until 2031, with a fertility rate of 1.8 in 2020-2030. The 2019 revision of the WPP also predicted that China’s population would not drop until 2032, with a fertility rate of 1.7 in 2020-2025.
Now, China officially acknowledges that its population began to decline in 2022, with a fertility rate of just 1.0. Data from other sources, such as BCG vaccine distribution, a massive population data leak from the Shanghai Police Department, and the Baidu index, confirm my conclusion that China’s population did indeed
only temporarily boost the fertility rate to 1.4. However, China’s most authoritative demographers predicted that the two-child policy would raise the fertility rate to 4.4 or 4.5, with 47 million or 50 million births annually.

China implemented the twochild policy in 2016, with the official expectation of a birth peak in 2018. However, even by the exaggerated figures of the Health Yearbook, the number of births in 2018 was only 13.6 million, with a fertility rate of 1.4.
begin to decline in 2018 and is now less than 1.28 billion, rather than the official figure of 1.41 billion.
Q: Is China’s two-child policy also based on faulty demographic projections?
A: In 2012, I advised the Chinese authorities to skip the two-child policy because I predicted it would
Q: How is the economy closely related to population?
A: Demographic structure and people’s physiology and psychology all affect economic vitality. The labor force is the backbone of the economy, and aging is its drag.
Median age, old-age dependency ratio, and the proportion of people over 64 all have a strong nega-
tive correlation with GDP growth. In contrast, the proportion of children aged 0-14 positively correlates with GDP growth. These correlations are found in longitudinal comparisons in Italy, Japan, and other countries over the years and in horizontal comparisons among Chinese provinces.
China’s GDP grew at an average annual rate of 10% from 1979 to 2011. Economists in the government predicted it would continue for decades, making China’s economy two or three times the size of the US.
In 2004, I predicted from a demographic perspective that 2012 would be an inflection point for China’s economic growth, which proved correct as GDP growth slowed to 7% in 2015 and 3% in 2022.
By 2031-2035, China will be doing worse than the US in terms of demographic metrics and economic growth, and its GDP size is unlikely to surpass that of the US.
Q: Why do you think the US is the second biggest victim of China’s one-child policy?
A: The one-child policy has reduced family size and needs, leading to an expanding government and high savings rates. In 1983, China’s household disposable income accounted for 62% of GDP, but only 40-44% in 20052020, compared to 60-70% in the international community. China’s average savings rate in 2005-2020
was as high as 47%, compared with 24% in the rest of the world.
Much of China’s savings has gone into American government bonds, government-backed mortgage debt, and China’s property. The former fueled the US housing bubble and its collapse, contributing to the global financial crisis of 2008. The latter has led to China’s property bubble, whose bursting could trigger another global financial crisis.
The consequence of low disposable income and high savings is weak domestic consumption, with household consumption in China accounting for only 38% of GDP in 2001-2020, compared to 68% in the US and 59% in India.
China has always pursued a trade surplus to digest excess capacity, two-thirds of which is with the US. The ratio of imports from the US to exports to the US in 2010-2022 was only 23% for China, compared with 72% for the rest of the world as a whole. Such unbalanced U.S.-China trade has led to a sharp decline in US manufacturing. The US share of world manufacturing exports stabilized at 13% between 1970 and 2000 but fell to 6% in 2021. Unbalanced U.S.-China trade benefited the US bond market and hurt the real economy, thus exacerbating the social tear in the US and deeply affecting its elections. In 2009, in a paper published in an academic journal in Hong Kong, I warned of a possible U.S.-China trade war and predicted that the US would revive manufacturing.
China’s aging is continuing to reshape America’s economy. For example, China’s shrinking labor force is creating new inflationary pressures in the US and elsewhere.
Q: Finally, what would you say to students at UW-Madison?
A: Society is becoming increasingly complex, and it is difficult to grasp the game rules in the economy with knowledge from a single discipline. There will probably be a paradigm revolution in the academic and socio-economic systems. Society needs someone across large disciplinary boundaries to engage in interdisciplinary research, but personally, it’s painful, costly, and difficult to obtain funding. That said, I would suggest that UW students have solid knowledge in their primary major (life will be much easier), broaden their horizons, and be open to new information from different fields, including those you have never set foot on. Also, be sure to follow the big trends of the world and prepare to adjust your life courses accordingly.
Major cities in the US are full of contrasts: rich and poor, skyscrapers and slums, expensive and dangerous. These present a serious problem for economic activity and growth because major cities are where most opportunities for economic advancement tend to be. However, if big cities are expensive and dangerous, it indicates fewer people will live in these cities and thus fewer will have ac-
cess to economic opportunities.The largest urban cores in the US such as Boston (-3.09% 2020 to 2021), New York (-3.82% 2020 to 2021), and San Francisco (-6.72% 2020 to 2021) have recently seen an unprecedented exodus and rapid declines in population due to people leaving for smaller cities that are safer and more affordable than large cities are. The hypothesis this paper argues is that income inequality in major cities plays a role in why big cities are both very expensive and dangerous.
The data used for income is census data for the average income (after transfers, before taxes) of members of the top 20% and the bottom 20% of each of the top 50 largest cities in the US. The Zumper National rent report provided the data for typical one-bedroom apartment rents. The homicide rate data for the 50 largest cities in the country was sourced from Macrotrends.com (Note: unfortunately, 2018 was the most recent year with data), which in turn sourced it from the FBI (Macrotrends.com was used rather than directly sourcing from the FBI because Macrotrends.com formats data in a more usable format than the FBI). The homicide rate was used as a proxy for crime because

homicide data is the most comparable crime across municipalities due to everyone defining homicide the same way unlike some other crimes which are more subjective in nature and would make for bad data. For example, the precise definition of a robbery differs by city based on local laws. It leads to the official crime statistics being a bit different in two cities with the same level of robberies, and a similar effect for other crimes. Homicide, on the other hand, is measured by every city using the same straightforward definition. Homicide rates tend to be higher in cities where crime is overall higher, such as Philadelphia and Chicago. Therefore, using this standardized measure as an overall proxy for crimes should be valid.
The homicide rate and rent datasets were merged with the income percentile dataset to investigate how the income of the top 20% and bottom 20% of a city correlate with the given city’s typical rent and homicide rate. Rent prices were predicted extremely well by how much people on the top of the economic spectrum in a given city made. Typical rent was predicted far better by the income of the top 20% of households than by the income of the bottom 20% of households. This is likely because the top 20% of households in a city can bid up the rent as much as they want, whereas lower-income households can’t bid up rent (Arefava, 2016). On the other hand, crime was extremely
well predicted by how little people on the bottom of the economic spectrum in a given city made. Homicide was predicted far better by how much the bottom 20% of households earned than by how much the top 20% of households earned. This is likely because most crime is committed by people on the lower end of the economic spectrum (Patterson 1991). Because rent is correlated positively with the income of the top 20% and crime is correlated negatively with the income of the
bottom 20%, it seems logical that the larger the gap between the top 20% and bottom 20% the higher rent and crime will be. With a high income gap, the rich will be “rich” enough that they massively bid up rent prices, and the poor will be so “poor” they commit lots of crimes. Major cities have lots of income inequality, with a vast gulf between the top 20% and the bottom 20% , it thus makes sense that major cities have high rent and high crime rates.
The most common way to measure income inequality is the Gini coefficient (Catalano, Lesie, & Pfaff, 2009). It is a number ranging from 0 to 1, where 0 is perfect equality and 1 is a single entity controlling all of a given resource. The census calculates the Gini coefficient of income inequality for each city in the US, and this dataset was merged with the previous two in order to investigate the relationship between income inequality and a measure of combined standardized rent and homicide rate. This combined standardized measure was created by adding the Z score of each city’s typical rent value and the Z score of that city’s homicide rate (Z score is a statistical method for standardizing data). When comparing this combined standardized measure of rent and homicide rate, the average income of people in the middle-income quintile of the R2 is nearly zero (0.021). However, if the urban cores of metropolitan areas with over 4 million are isolated, it is clear that the measure is higher in those cities than in the others (1.095 vs -0.426). There is clearly something driving this standardized measure of rent and homicide to be higher in big cities, and it may not be the income of a typical household since the correlation with the income of a typical household is nearly 0. The Gini coefficient was predictive of cities’ combined standardized rent and homicide rate (R^2 of 0.427), and

both of these stats are particularly high in the urban cores of the largest metropolitan areas in the country. Income inequality, rather than absolute income, best predicts rent and homicide in big cities.
The average Gini coefficient in urban cores of metropolitan areas with over 4 million people is 0.5268, compared to 0.4733 for other cities in the top 50. This may not appear to be a large gap on the surface; however, it is a gap of more than one standard deviation (the standard deviation for Gini coefficient of the 50 largest cities in the US is 0.0336). Using a two tailed unpaired t-test, the p-value for this difference is less than 0.0001, meaning the difference in mean Gini between large urban cores and other cities is statistically significant. The average combined Z score of rent and homicide rates in urban cores of metropolitan areas with over 4 million people is 1.0952, for other cities in the top 50, it is -0.4259. Using a two tailed unpaired t-test, the p-value for this difference is less than 0.0001; in other words, this difference between urban cores of metropolitan areas with over 4 million people and the other cities is also very statistically significant. Although it requires more rigorous methods to prove casualty, it seems that how expensive and dangerous a city is has to do with not just how much income there is but how that income is distributed. Our nation’s largest cities are currently in population decline due to being both expensive and dangerous, and this
BY GEORGE VAJAGICHlikely has to do with the fact that income is distributed very unevenly in those cities. If our nation’s major cities want to reverse this decline, they should likely look at reducing this trend of massive income inequality.
______
Arefeva, Alina. “How Auctions Amplify House-Price Fluctuations.” Stanford University, February 2016.
Catalano, Michael T., Tanya L. Leise, and Thomas J. Pfaff. “Measuring Resource Inequality: The Gini Coefficient.” Numeracy 2, Iss. 2 (2009): Article 4.
Patterson, Britt E. “Poverty, Income Inequality, and Community Crime Rates.” Criminology, November 1991.
Data Citation https://censusreporter.org/tables/ B19081/ https://censusreporter.org/tables/ B19083/ https://www.zumper.com/blog/ rental-price-data/ https://www.macrotrends.net/cities/us/md/Baltimore/murder-homicide-rate-statistics


Benjamin Bernard, Assistant Professor
Matteo Camboni, Assistant Professor
Stella Chan, Lecturer
Harold Chiang, Assistant Professor
Gwen Eudey, Senior Lecturer
Rebecca Glawtschew, Lecturer
Jesse Gregory, Associate Professor
David Hansen, Lecturer
Korinna Hansen, Senior Lecturer
Christopher McKelvey, Lecturer
Gregory Pac, Senior Lecturer
Gwyn Pauley, Lecturer
Jeffrey Smith, Professor, Paul T. Heyne Distinguished Chair in Economics; Richard A. Meese Chair in Applied Econometrics
Lones Smith, Professor,
Maude P. & Milton J. Shoemaker Distinguished Chair; David Blackwell Professor of Economics
Fuxian Yi, Senior Scientist
Equilibrium is made possible by the students who have researched, written, designed, edited, and created each word and every page. To join Equilibrium and help publish Volume 14, visit equilibriumecon.wisc.edu/.

