CAREER OUTCOMES REPORT 2021-2022


2021-2022 SUMMARY
Introduction
This report contains career outcomes or “first destination data” collected by the Center for Career Development & Academic Exploration (CCDAE) for the class of 2022: August 2021, December 2021, and May 2022 graduates.
Methodology
The CCDAE follows first destination survey protocols set forth by the National Association of Colleges and Employers (NACE) and participates in NACE’s annual data collection. The center utilizes 12Twenty, a student outcomes reporting platform and database. Staff collected data on graduates through a variety of means including: emails, phone calls, in-person events, information collected by academic departments, institutional records, and social media outlets, e.g., LinkedIn. Data is collected up to six months past graduation.
Outcomes
NACE defines knowledge rate as “the percent of graduates for which the institution has reasonable and verifiable information concerning the graduates’ postgraduation career activities.”
Of graduating bachelor’s students, the overall knowledge rate is 81 percent, up from 75 percent last year. The target rate designated by NACE is 65 percent. Knowledge rates for the nine undergraduate colleges range from 68 percent to 93 percent. Because a significant amount of outcomes is collected second hand through social media searches, salary data is lacking. Additionally, students are often hesitant to share their salaries even when providing their outcomes directly.
Gathering career outcomes for graduate students is more challenging, and the knowledge rate is 63 percent for master’s students and 77 percent for doctoral students. The CCDAE continues to look at new methods of increasing UT’s knowledge rate and improving the quality of the data. Some departments and colleges, particularly those that are considered “professional programs,” collect career outcomes data to meet requirements set forth by accrediting bodies. Specifically, the
colleges of Nursing and Social Work report data for their graduates. Graduate business programs in Haslam College of Business and the College of Law also collect and report data. While the CCDAE and colleges share data as reported here, individual colleges can be contacted for more detailed information.
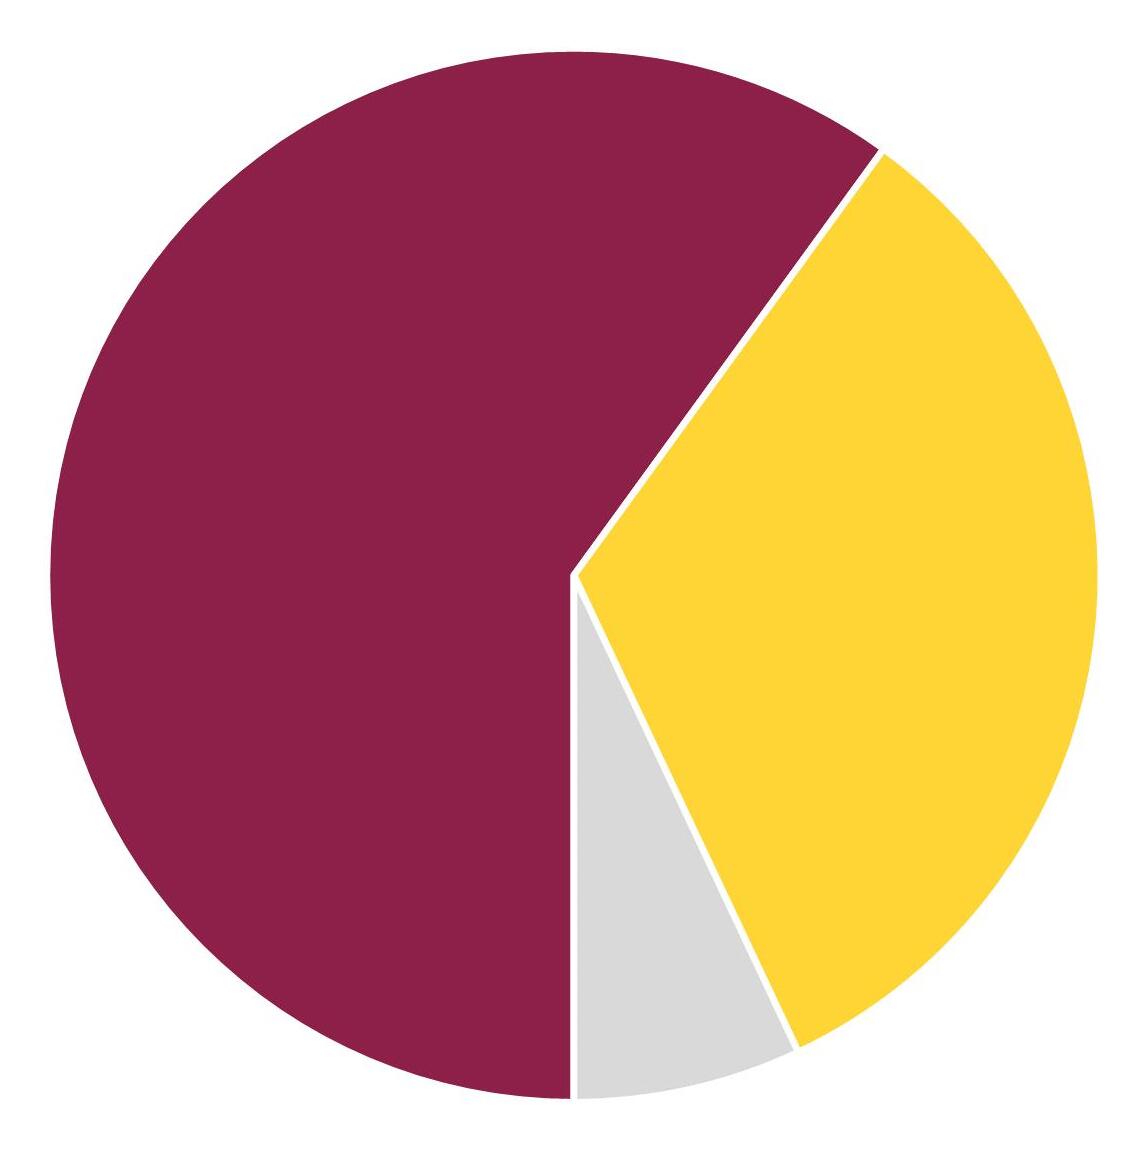
The infographic that follows presents highlights of the career outcomes data for 2022 bachelor’s graduates. The following pages contain all data collected by degree type and by college major. The rate of bachelor’s students employed six months post-graduation is 64 percent, up from 61 percent in 2021. The percent of students reporting continued education is 26 percent. With a positive career outcome rate of 90 percent and an additional 2 percent reporting “not seeking,” just 8 percent of students are still seeking jobs or education six months beyond graduation. It is likely that some of that 8 percent did in fact achieve an outcome but did not report it to the university.
The median salary increased this year, from $51,365 in 2021 to $56,284, likely in part to a robust job market. Salary statistics for graduate students are not provided by program due to inadequate data.
Terms and Categories
To understand the data that follows, it is necessary to define key terminology. Employed includes fulltime and part-time employment, military service, and work with a service organization such as AmeriCorp. For bachelor’s graduates, 60.8 percent of the employed category were employed full-time with 1.9 percent employed part-time, .8 percent in the military, and .2 percent in service organizations. Continuing education includes students pursuing graduate degrees or additional bachelor’s degrees. Not seeking includes a variety of reasons, such as starting a family, taking more than four months off, studying abroad, research, or artistic pursuits. Seeking employment and seeking continuing education are self-explanatory. In some cases, students may have secured an outcome, but the university was not able to update the student’s status because no additional information was reported or collected.
UNIVERSITY OF TENNESSEE, KNOXVILLE | CAREER OUTCOMES REPORT | 2021-2022 2


UNIVERSITY OF TENNESSEE, KNOXVILLE | CAREER OUTCOMES REPORT | 2021-2022 3
Outcomes for Bachelor’s Degrees WHAT ARE THEY DOING? WHAT ARE THEY MAKING? WHERE ARE THEY? 70% COMPLETED AN INTERNSHIP, CO-OP, OR SIMILAR EXPERIENCE Top Employers University of Tennessee PepsiCo/Frito-Lay Pilot Flying J
Medical Center Vanderbilt University Medical Center
Graduate Schools
of Tennessee
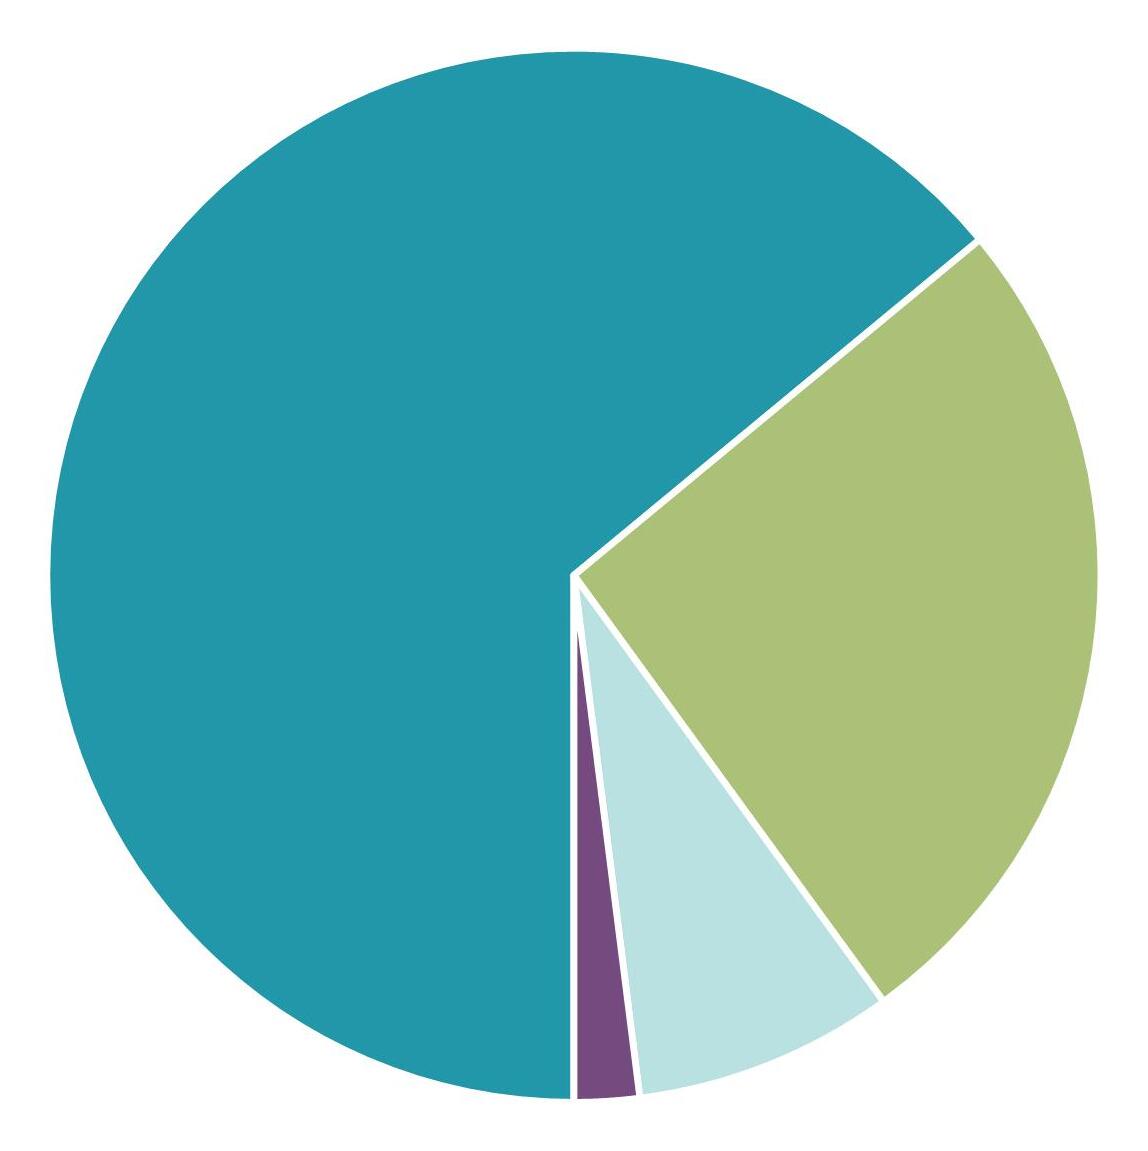
Health Science Center Lincoln Memorial University Belmont University Vanderbilt University Mean Salary $56,625 Median Salary $56,284 Highest Salary $175,000 64% Employed 26% Graduate School Still seeking employment or grad school 2% 60% Employed In State 33% Employed Out of State 7% Undisclosed 8% Other or not seeking Information gathered on 81% of graduating students.
2021-2022 OUTCOMES
UT
Top
University
UT
UNIVERSITY OF TENNESSEE, KNOXVILLE | CAREER OUTCOMES REPORT | 2021-2022 4
Herbert College of Agriculture 355 255 72% 61.9% 1.2% 28.9% 2% 3.5% 2.3% Architecture & Design 101 90 89% 72.3% 0% 25.3% 1.1% 0% 1.1% Arts & Sciences 1651 1127 68% 45.8% 1.4% 37.7% 6.6% 4.6% 3.8% Haslam College of Business 1248 1165 93% 80.4% 1.2% 11.9% 4.6% <1% 1.1% Communication & Information 354 300 85% 72% 0% 9.3% 14% 1% 3.7% Education, Health, & Human Sciences 616 488 79% 42% <1% 48.5% 3.7% 3.3% 1.8% Tickle College of Engineering 676 590 87% 64.9% 1.6% 26.3% 5.6% 1.2% <1% Nursing 257 213 83% 90.6% <1% <1% 6.6% <1% 1.4% Social Work 73 66 90% 24.2% 0% 66.7% 6.1% 1.5% 1.5% University of Tennessee, Knoxville 5331 4294 81% 62.6% 1% 26.2% 5.7% 2.3% 2.1% Numberof GraduatesNumberResponded Service/MilitaryContinuingEducation EmployedResponseRate SeekingEmploymentSeekingEducationNotSeeking Degree: Bachelor’s
2021-2022 OUTCOMES
UNIVERSITY OF TENNESSEE, KNOXVILLE | CAREER OUTCOMES REPORT | 2021-2022 5
OUTCOMES Herbert College of Agriculture 85 61 72% 73.8% 0% 24.6% 0% 0% 1.6% Architecture & Design 46 37 80% 94.6% 0% 2.7% 2.7% 0% 0% Arts & Sciences 177 136 77% 56.6% <1% 35.3% 2.9% <1% 3.7% Haslam College of Business 273 175 64% 86.2% <1% 2.2% 3.4% <1% 6.8% Communication & Information 161 109 68% 86.2% 0% <1% 7.3% 1.8% 3.7% Education, Health, & Human Sciences 303 187 62% 86.1% 0% 11.8% 1.6% <1% 0% Tickle College of Engineering 195 140 72% 70.7% 0% 25.7% 2.9% 0% <1% Nursing 20 14 70% 100% 0% 0% 0% 0% 0% Social Work 243 93 38% 97.9% 0% 0% 2.2% 0% 0% Intercollegiate 3 2 67% 50% 0% 50% 0% 0% 0% University of Tennessee, Knoxville 1506 954 63% 80.2% <1% 13.4% 2.9% <1% 2.4% Numberof GraduatesNumberResponded Service/MilitaryContinuingEducation EmployedResponseRate SeekingEmploymentSeekingEducationNotSeeking Degree: Master’s
2021-2022
UNIVERSITY OF TENNESSEE, KNOXVILLE | CAREER OUTCOMES REPORT | 2021-2022 6
OUTCOMES Herbert College of Agriculture 24 17 70.8% 88.2% 0% 0% 5.9% 0% 5.9% Arts & Sciences 131 95 72.5% 93.7% 1.1% 0% 2.1% 1.1% 2.1% Haslam College of Business 14 13 92.8% 100% 0% 0% 0% 0% 0% Communication & Information 6 5 83.3% 80% 0% 0% 0% 0% 20% Education, Health, & Human Sciences 57 45 78.9% 97.8% 0% 0% 0% 2.2% 0% Tickle College of Engineering 104 74 71.1% 91.9% 0% 0% 2.7% 2.7% 2.7% Nursing 30 28 93.3% 100 0% 0% 0% 0% 0% Social Work 21 14 66.6% 92.9% 0% 0% 0% 0% 7.1% Veterinary Medicine 84 67 79.7% 91.1% 0% 0% 1.5% 0% 7.5% Intercollegiate 25 23 92% 95.7% 0% 0% 4.3% 0% 0% University of Tennessee, Knoxville 496 381 76.8% 93.7% <1% 0% 1.8% 1% 3.1% Numberof GraduatesNumberResponded Service/MilitaryContinuingEducation EmployedResponseRate SeekingEmploymentSeekingEducationNotSeeking Degree: Doctorate
2021-2022
2021-2022 EMPLOYMENT
Over the course of the year, approximately 900 unique organizations engaged with students through job fairs, networking events, panels, employer of the day, and other programs. Additionally, 100,000 jobs from thousands of employers were posted on the Handshake platform for UT students to access. Some students find employment opportunities through engagement with university sponsored events and others will find jobs through their own networking and searching. Over 2,000 distinct organizations hired graduates from the class of 2022. Below are the top hiring organizations for our bachelor’s graduates.
TOP EMPLOYERS
Employed more than 20 graduates
University of Tennessee
PepsiCo/Frito-Lay, Inc.
Pilot Flying J
University of Tennessee Medical Center
Vanderbilt University Medical Center
Axle Logistics
21st Mortgage Corporation
Employed between 10-20 graduates
Amazon.com, Inc.
Insight Global
J.B. Hunt Transport, Inc.
DENSO Manufacturing
Deloitte
East Tennessee Children’s Hospital
Total Quality Logistics
Home Depot
Oracle
Eastman Chemical Company
Knox County Schools
Techtronic Industries (TTI)
Jewelry Television (JTV)
NTT Data
AT&T
Dell
Helen Ross McNabb
Philips
Y-12 National Security Complex/CNS
Employed between 5-10 graduates
Covenant Health
DHL Supply Chain
Enterprise Holdings, Inc.
International Paper
Schneider Electric
Tennessee Valley Authority (TVA)
Blackberry Farm
Knoxville Utilities Board (KUB)
Manhattan Associates
Walt Disney Company (The)
Alliance Bernstein
Capgemini
DeRoyal
Duke University Medical Center
Parkwest Medical Center
Shaw Industries
CGI
E & J Gallo Winery
FedEx
Genesis Neuroscience Clinic
HCA Healthcare
Johns Hopkins Medicine
Kimberly-Clark Corporation
Procter & Gamble
Tombras Group
United States Army
Ascension Saint Thomas Midtown Hospital
Boeing Company
Clayton Homes
Deloitte & Touché LLP
Fort Sanders Regional Medical Center
Leidos
Lockheed Martin
Nissan North America
Oracle Netsuite
Ryder System, Inc.
Saint Thomas Hospital
Sysco Foods
Target
Tractor Supply Co.
U.S. Forest Service
University of Tennessee Athletics
Zoo Knoxville
UNIVERSITY OF TENNESSEE, KNOXVILLE | CAREER OUTCOMES REPORT | 2021-2022 7
2021-2022 SALARIES
Salary data is more challenging to collect as not all students will report it, and data collected from alternative means, such as LinkedIn profiles, will not include salaries. UT’s salary varies widely by college and major. The mean and median have been steadily rising each year. Because the number of salary data points for graduate students is not sufficient, only college means and medians are reported.
NumberofSalariesSalaryHigh
SalaryMedian SalaryLow Mean2020-2021Mean2019-2020Mean2018-2019
SalaryMean2021-2022
UNIVERSITY OF TENNESSEE, KNOXVILLE | CAREER OUTCOMES REPORT | 2021-2022 8
Herbert College of Agriculture 79 $125,000 $20,800 $45,000 $47,918 $39,932 $40,296 $44,490 Architecture & Design 45 $65,000 $33,280 $55,000 $53,620 $49,753 $46,699 $42,068 Arts & Sciences 128 $139,000 $20,400 $41,000 $44,585 $38,224 $38,385 $37,477 Haslam College of Business 504 $175,000 $20,000 $58,805 $58,302 $53,868 $53,226 $51,380 Communication & Information 52 $66,306 $22,880 $45,000 $44,711 $45,059 $42,231 $36,807 Education, Health, & Human Sciences 55 $65,000 $24,960 $40,000 $41,826 $37,204 $32,868 $34,767 Tickle College of Engineering 196 $129,000 $31,000 $70,000 $71,146 $65,836 $66,302 $65,807 Nursing 125 $108,000 $43,200 $60,000 $58,664 $49,520 $44,785 $42,948 Social Work 6 $42,000 $22,000 $32,000 $31,667 $29,760 $50,000 $30,207 University of Tennessee, Knoxville 1190 $175,000 $20,000 $56,284 $56,624 $51,395 $51,240 $46,396
Degree: Bachelor’s
UNIVERSITY OF TENNESSEE, KNOXVILLE | CAREER OUTCOMES REPORT | 2021-2022 9
Herbert College of Agriculture 7 $63,000 $30,000 $42,000 $44,074 Architecture & Design 12 $80,000 $55,000 $57,600 $59,433 Arts & Sciences 11 $84,000 $33,000 $48,200 $51,412 Haslam College of Business 41 $170,000 $50,000 $70,000 $87,839 Communication & Information 20 $85,000 $35,360 $52,000 $52,397 Education, Health, & Human Sciences 25 $87,500 $35,000 $47,537 $51,509 Tickle College of Engineering 23 $175,000 $56,000 $89,500 $91,422 Nursing 0 N/A N/A N/A N/A Social Work 16 $65,000 $35,000 $45,000 $47,564 Intercollegiate 0 N/A N/A N/A N/A University of Tennessee, Knoxville 155 $175,000 $30,000 $56,000 $64,284
Degree: Master’s
2021-2022 SALARIES
NumberofSalariesSalaryHigh SalaryMean2021-2022 SalaryMedian SalaryLow
UNIVERSITY OF TENNESSEE, KNOXVILLE | CAREER OUTCOMES REPORT | 2021-2022 10
Herbert College of Agriculture 2 $140,000 $50,000 $95,000 $95,000 Arts & Sciences 14 $140,000 $46,000 $80,790 $79,758 Haslam College of Business 2 $155,000 $125,000 $140,000 $140,000 Communication & Information 1 $53,500 $53,500. $53,500 $53,500 Education, Health, & Human Sciences 6 $90,000 $58,182 $71,500 $72,697 Tickle College of Engineering 19 $170,000 $45,000 $95,000 $99,755 Nursing 6 $110,000 $35,000 $80,750 $76,083 Social Work 1 $93,600 $93,600 $93,600 $93,600 Veterinary Medicine 13 $120,000 $30,000 $84,000 $76,000 Intercollegiate 9 $120,000 $75,000 $95,000 $98,542 University of Tennessee, Knoxville 73 $170,000 $30,000 $88,700 $87,625
Degree: Doctorate
2021-2022 SALARIES
NumberofSalariesSalaryHigh SalaryMean2021-2022 SalaryMedian SalaryLow
2021-2022 EDUCATION
Half of all students who continue their education do so at a University of Tennessee institution. Other schools most popular with our students are in Tennessee. Below is a more comprehensive list of where graduates choose to earn their graduate degrees.

GRADUATE SCHOOLS
University of Tennessee (TN)
University of Tennessee Health Science Center (TN)
Lincoln Memorial University (TN)
Belmont University (TN)
Vanderbilt University (TN)
East Tennessee State University (TN)
University of Tennessee--Chattanooga (TN)
University of Florida (FL)
South College (TN)
Georgia Institute of Technology (GA)
Georgia State University (GA)
University of Memphis (TN)
Boston University (MA)
Middle Tennessee State University (TN)
Purdue University--West Lafayette (IN)
University of Kentucky (KY)
University of Michigan--Ann Arbor (MI)
Arizona State University (AZ)
Carson-Newman College (TN)
George Washington University (DC)
Johnson University (TN)
Louisiana State University--Baton Rouge (LA)
Medical University of South Carolina (SC)
TOP AREAS OF STUDY
Education
Healthcare
Business
Engineering
Arts & Sciences
Law
Social Work
Agriculture and Natural Resources
Veterinary Medicine
Architecture
Communication
Divinity
Northwestern University (IL)
Ohio State University--Columbus (OH)
Pennsylvania State University--University Park (PA)
Tennessee State University (TN)
University of Colorado--Boulder (CO)
University of Georgia (GA)
University of St. Augustine (CA)
Healthcare includes Medical, Dental, Physical Therapy, Optometry, Audiology/Speech Pathology, Nursing, Public Health, Mental Health (excluding clinical Social Work and School Counseling/Psychology) and various other Allied Health programs.
Education includes K-12, Higher Education, Child and Family Studies, School Counseling/Psychology, Nutrition, Exercise, Sports/Athletics, Retail, and Hospitality.

UNIVERSITY OF TENNESSEE, KNOXVILLE | CAREER OUTCOMES REPORT | 2021-2022 11
UNIVERSITY OF TENNESSEE, KNOXVILLE | CAREER OUTCOMES REPORT | 2021-2022 12
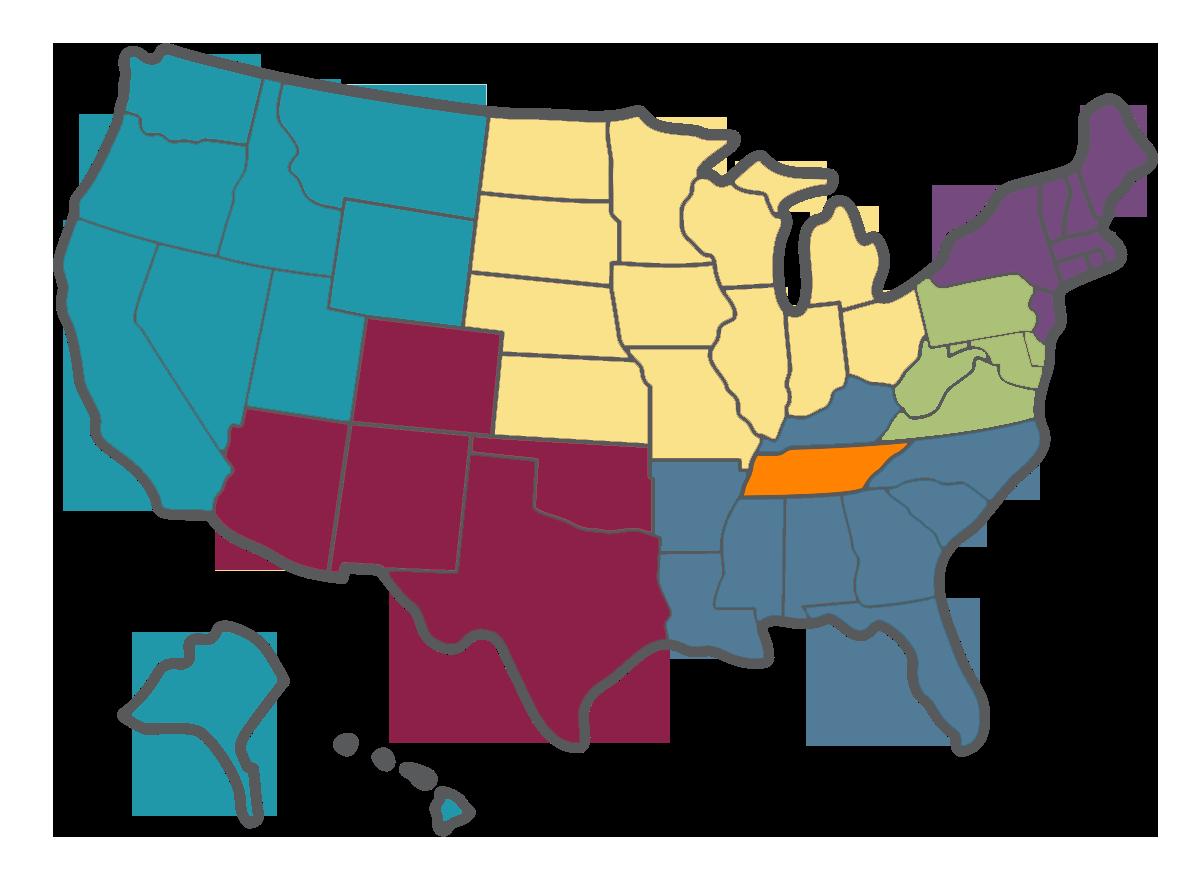
LOCATIONS West 3% Midwest 5% South 80% Northeast 2% Not in North America 1% Herbert College of Agriculture 99 67.8% 38 26.0% 9 6.2% 146 Architecture & Design 38 58.5% 25 38.5% 2 3.1% 65 Arts & Sciences 303 65.9% 126 27.4% 31 6.7% 460 Haslam College of Business 504 55.1% 335 36.6% 76 8.3% 915 Communication & Information 118 59.3% 65 32.7% 16 8.0% 199 Education, Health, & Human Sciences 138 71.1% 47 24.2% 9 4.6% 194 Tickle College of Engineering 198 53.1% 151 40.5% 24 6.4% 373 Nursing 115 59.6% 75 38.9% 3 1.6% 193 Social Work 10 66.7% 1 6.7% 4 26.7% 15 Totals 1523 59.5% 863 33.7% 174 6.8% 2560 In-State In-State% Out-of-StateUndisclosedUndisclosed% % Out-of-State GrandTotal GEOGRAPHICAL LOCATIONS Of all bachelor’s graduates reporting job locations, 60% stay in Tennessee and 33% in Knoxville Southwest 5% Mid Atlantic 4%
2021-2022
COLLEGE OUTCOMES


UNIVERSITY OF TENNESSEE, KNOXVILLE | CAREER OUTCOMES REPORT | 2021-2022 13
UNIVERSITY OF TENNESSEE, KNOXVILLE | CAREER OUTCOMES REPORT | 2021-2022 14
AGRICULTURE Agricultural Leadership, Education, & Communication 11 8 73% 75% 0% 25% 0% 0% 0% Animal Science 101 73 72% 34.3% 0% 56.2% 1 .4% 6.8% 1 .4% Biosystems Engineering 9 7 78% 57.1% 0% 42.9% 0% 0% 0% Construction Science & Ag Systems 43 33 77% 100% 0% 0% 0% 0% 0% Environmental & Soil Sciences 25 18 72% 72.2% 5.6% 0% 11.1% 11.1% 0% Food & Agricultural Business 15 12 80% 58.3% 0% 33.3% 0% 0% 8.3% Food Science 25 12 48% 50% 0% 41.7% 0% 0% 8.3% Food Science & Technology 3 3 100% 33.3% 0% 66.7% 0% 0% 0% Forestry 24 17 71% 18.3% 0% 11.8% 0% 0% 0% Natural Resource & Environmental Economics 5 4 80% 25% 0% 75% 0% 0% 0% Plant Sciences 38 31 82% 62.4% 0% 21.9% 3.1% 3.1% 9.4% Wildlife & Fisheries Science 56 37 66% 75.7% 5.4% 13.5% 2.7% 2.7% 0% Herbert College of Agriculture 355 255 72% 61.9% 1 .2% 28.9% 2% 3.5% 2.3% Numberof GraduatesNumberResponded Service/MilitaryContinuingEducation EmployedResponseRate SeekingEmploymentSeekingEducationNotSeeking Herbert College of Agriculture Degree: Bachelor’s
2021-2022
UNIVERSITY OF TENNESSEE, KNOXVILLE | CAREER OUTCOMES REPORT | 2021-2022 15
Agricultural Leadership, Education, & Communication 4 $125,000 $40,000 $40,500 $61,500 $31,800 $25,503 $37,809 Animal Science 5 $55,000 $28,000 $45,000 $43,200 $33,783 $25,503 $36,144 Biosystems Engineering 3 $80,000 $60,000 $70,000 $70,000 $65,250 $50,000 $63,071 Construction Science & Ag Systems 16 $70,000 $45,000 $63,620 $61,578 $58,750 $56,167 $27,040 Environmental & Soil Sciences 9 $75,000 $31,200 $50,000 $49,800 $31,941 $52,050 $58,470 Food & Agricultural Business 5 $40,000 $24,960 $40,000 $34,992 $46,450 $62,850 $45,000 Food Science 1 $65,000 $65,000 $65,000 $65,000 $65,000 $65,000 $65,000 Food Science & Technology 0 N/A N/A N/A N/A N/A N/A N/A Forestry 10 $55,000 $31,000 $39,435 $39,459 $30,400 $34,787 $33,410 Natural Resource & Environmental Economics 1 $53,518 $53,518 $53,518 $53,518 N/A N/A N/A Plant Sciences 12 $67,600 $29,120 $48,500 $46,250 $38,333 $41,550 $32,442 Wildlife & Fisheries Science 13 $44,000 $20,800 $35,360 $33,615 $33,932 $34,000 $30,364 Herbert College of Agriculture 79 $125,000 $20,800 $45,000 $47,918 $39,932 $40,296 $44,490 NumberofSalariesSalaryHigh SalaryMean2021-2022SalaryMedian SalaryLow Mean2020-2021Mean2019-2020Mean2018-2019 Herbert College of Agriculture Degree: Bachelor’s
2021-2022 AGRICULTURE
UNIVERSITY OF TENNESSEE, KNOXVILLE | CAREER OUTCOMES REPORT | 2021-2022 16 Herbert College of Agriculture Degree: Master’s
AGRICULTURE Agricultural & Resource Economics 10 6 60% 50% 0% 33.3% 0% 0% 16.7% Agricultural Leadership, Education, & Communication 32 20 63% 95% 0% 5% 0% 0% 0% Animal Science 10 8 80% 87.5% 0% 12.5% 0% 0% 0% Biosystems Engineering 3 3 100% 33.3% 0% 66.7% 0% 0% 0% Entomology & Plant Pathology 10 8 80% 25% 0% 75% 0% 0% 0% Environmental & Soil Sciences 4 1 25% 100% 0% 0% 0% 0% 0% Food Science & Technology 2 2 100% 100% 0% 0% 0% 0% 0% Forestry 6 6 100% 83.3% 0% 16.7% 0% 0% 0% Plant Sciences 3 3 100% 33.3% 0% 66.7% 0% 0% 0% Wildlife & Fisheries Science 5 4 80% 100% 0% 0% 0% 0% 0% Herbert College of Agriculture 85 61 72% 73.8% 0% 24.6% 0% 0% 1.6% Numberof
Service/MilitaryContinuingEducation
SeekingEmploymentSeekingEducation
2021-2022
GraduatesNumberResponded
EmployedResponseRate
NotSeeking
UNIVERSITY OF TENNESSEE, KNOXVILLE | CAREER OUTCOMES REPORT | 2021-2022 17
Animal Science 4 2 50 50% 0% 0% 0% 0% 50% Entomology & Plant Pathology 1 1 100 100% 0% 0% 0% 0% 0% Food Science & Technology 5 4 80 80% 0% 0% 0% 0% 0% Natural Resource & Environmental Economics 5 3 60 100% 0% 0% 0% 0% 0% Plants, Soils, & Insects 9 7 77.7 85.7% 0% 0% 14.3% 0% 0% Herbert College of Agriculture 24 17 70.8 88.2% 0% 0% 5.9% 0% 5.9% Numberof GraduatesNumberResponded Service/MilitaryContinuingEducation EmployedResponseRate SeekingEmploymentSeekingEducationNotSeeking Veterinary Medicine 84 67 79.7% 91.1% 0% 0% 1.5% 0% 7.5% Herbert College of Agriculture Degree: Doctorate
2021-2022 AGRICULTURE
2021-2022 ARCH & DESIGN
UNIVERSITY OF TENNESSEE, KNOXVILLE | CAREER OUTCOMES REPORT | 2021-2022 18
Architecture 70 60 86% 70.5% 0% 26.2% 1.6% 0% 1.6% Interior Architecture 31 30 97% 76.6% 0% 23.3% 0% 0% 0% Architecture & Design 101 90 89% 62.3% 0% 25.3% 1.1% 0% 1.1% Numberof GraduatesNumberResponded Service/MilitaryContinuingEducation EmployedResponseRate SeekingEmploymentSeekingEducationNotSeeking College of Architecture & Design does not award doctorate degrees. Architecture 18 16 89% 100% 0% 0% 0% 0% 0% Interior Architecture 28 21 75% 90.5% 0% 4.8% 4.8% 0% 0% Architecture & Design 46 37 80% 94.6% 0% 2.7% 2.7% 0% 0% Degree: Master’s College of Architecture & Design Degree: Bachelor’s
UNIVERSITY OF TENNESSEE, KNOXVILLE | CAREER OUTCOMES REPORT | 2021-2022 19 Architecture 30 $65,000 $36,000 $55,500 $54,821 $51,000 $47,476 $50,816 Interior Architecture 15 $60,000 $33,280 $52,000 $51,219 $46,013 $43,333 $42,359 Architecture & Design 45 $65,000 $33,280 $55,000 $53,620 $49,753 $46,699 $42,068 NumberofSalariesSalaryHigh SalaryMean2021-2022SalaryMedian SalaryLow Mean2020-2021Mean2019-2020Mean2018-2019
College of Architecture & Design Degree: Bachelor’s
2021-2022 ARCH & DESIGN
UNIVERSITY OF TENNESSEE, KNOXVILLE | CAREER OUTCOMES REPORT | 2021-2022 20 College of Arts & Sciences Degree: Bachelor’s
Anthropology 56 32 57% 37.5% 0% 40.6% 9.4% 3.1% 9.4% Art 5 3 60% 0% 0% 66.7% 0% 0% 33.3% Art History 3 0 0% 0% 0% 0% 0% 0% 0% Biological Sciences 257 164 64% 43.9% 1.2% 43.9% 4.3% 4.9% 1.8% Chemistry 39 35 90% 45.7% 2.9% 40% 2.9% 2.9% 5.7% Classics 9 7 78% 0% 0% 57.1% 28.6% 14.3% 0% College Scholars Program 14 11 79% 45.5% 0% 54.5% 0% 0% 0% Economics - Arts & Sciences 38 24 63% 62.5% 0% 25% 8.3% 0% 4.2% English 103 70 68% 40% 0% 52.9% 1.4% 1.4% 4.3% Geography 18 18 100% 38.9% 16.7% 27.8% 11.1% 0% 5.6% Geology & Environmental Studies 28 25 89% 72% 0% 24% 0% 4% 0% Global Studies 4 3 75% 66.7% 0% 0% 33.3% 0% 0% Graphic Design 16 15 94% 60% 0% 6.7% 20% 0% 13.3% History 58 40 69% 22.5% 2.5% 50% 10% 7.5% 7.5% Interdisciplinary Programs 64 35 55% 65.8% 0% 17.1% 11.4% 5.7% 0% Mathematics 43 32 74% 37.5% 0% 40.6% 12.5% 6.2% 3.1% Medical Laboratory Science 2 2 100% 50% 0% 0% 0% 0% 0% Numberof GraduatesNumberResponded Service/MilitaryContinuingEducation EmployedResponseRate SeekingEmploymentSeekingEducationNotSeeking
2021-2022 ARTS & SCIENCES
2021-2022 ARTS & SCIENCES
UNIVERSITY OF TENNESSEE, KNOXVILLE | CAREER OUTCOMES REPORT | 2021-2022 21
NumberofSalariesSalaryHigh SalaryMean2021-2022SalaryMedian SalaryLow Mean2020-2021Mean2019-2020Mean2018-2019 Anthropology 1 $35,000 $35,000 $35,000 $35,000 $35,810 N/A $35,533 Art 0 $0 $0 $0 $0 $24,000 N/A N/A Art History 0 $0 $0 $0 $0 N/A $29,120 N/A Biological Sciences 26 $56,284 $27,000 $40,280 $39,200 $34,922 $33,970 $29,660 Chemistry 3 $55,000 $35,360 $41,600 $43,987 $30,060 $33,873 $52,000 Classics 0 $0 $0 $0 $0 N/A $20,800 $41,000 College Scholars Program 1 $65,000 $65,000 $65,000 $65,000 $36,000 N/A $73,453 Economics - Arts & Sciences 2 $40,000 $38,000 $39,000 $39,000 $53,000 $60,000 $46,700 English 7 $46,000 $26,000 $40,000 $38,540 $44,947 $38,773 $25,800 Geography 1 $40,000 $40,000 $40,000 $40,000 $40,000 $33,600 $45,933 Geology & Environmental Studies 5 $47,000 $27,040 $35,360 $37,200 N/A $39,250 N/A Global Studies 1 $50,000 $50,000 $50,000 $50,000 N/A N/A N/A Graphic Design 2 $70,000 $42,000 $56,000 $56,000 $41,000 $20,800 N/A History 2 $62,000 $52,000 $57,000 $57,000 $40,700 $48,333 $43,213 Interdisciplinary Programs 4 $48,000 $35,000 $41,000 $41,250 $40,993 $39,987 $28,942 Mathematics 6 $139,000 $40,000 $56,000 $66,237 $43,250 $64,000 $40,462 Medical Laboratory Science 1 $49,920 $49,920 $49,920 $49,920 N/A $49,649 N/A College of Arts & Sciences Degree: Bachelor’s
2021-2022 ARTS & SCIENCES
UNIVERSITY OF TENNESSEE, KNOXVILLE | CAREER OUTCOMES REPORT | 2021-2022 22 College of Arts & Sciences Degree: Bachelor’s
Modern Foreign Languages 29 22 76% 59.1% 0% 31.8% 0% 0% 9.1% Music 38 29 76% 44.8% 0% 55.2% 0% 0% 0% Neuroscience 107 76 71% 51.3% 1.3% 26.3% 7.9% 7.9% 5.3% Philosophy 13 7 54% 0% 0% 57.1% 0% 28.6% 14.3% Physics 21 15 71% 33.3% 0% 53.3% 13.3% 0% 0% Political Science 144 106 74% 52.8% 3.7% 32.1% 1.9% 5.7% 3.8% Pre-Professional Programs 19 15 79% 0% 0% 100% 0% 0% 0% Psychology 358 226 63% 46% <1% 37.6% 7.5% 6.2% 1.8% Religious Studies 7 6 86% 83.3% 0% 16.7% 0% 0% 0% Sociology 86 54 63% 40.7% 3.7% 33.3% 14.8% 3.7% 3.7% Statistics - Arts & Sciences 24 19 79% 52.7% 0% 31.6% 15.8% 0% 0% Studio Art 22 18 82% 44.4% 0% 27.8% 0% 5.6% 22.2% Sustainability 12 10 83% 60% 0% 10% 20% 0% 10% Theatre 14 8 57% 87.5% 0% 0% 0% 0% 12.5% Arts & Sciences 1651 1127 68% 45.8% 1.4% 37.7% 6.6% 4.6% 3.8% Numberof GraduatesNumberResponded Service/MilitaryContinuingEducation EmployedResponseRate SeekingEmploymentSeekingEducationNotSeeking
2021-2022 ARTS & SCIENCES
UNIVERSITY OF TENNESSEE, KNOXVILLE | CAREER OUTCOMES REPORT | 2021-2022 23
NumberofSalariesSalaryHigh SalaryMean2021-2022 SalaryMedian SalaryLow Mean2020-2021Mean2019-2020Mean2018-2019 Modern Foreign Languages 6 $70,000 $20,400 $54,500 $52,650 $41,472 $37,500 $42,300 Music 3 $61,000 $31,200 $41,000 $44,400 $50,000 $36,554 $26,926 Neuroscience 6 $129,000 $28,870 $42,640 $56,905 $30,173 N/A N/A Philosophy 0 $0 $0 $0 $0 N/A $37,600 $27,847 Physics 2 $68,000 $24,000 $46,000 $46,000 N/A $58,800 N/A Political Science 12 $80,000 $23,000 $52,000 $49,527 $38,856 $43,240 $45,095 Pre-Professional Programs 0 $0 $0 $0 $0 N/A N/A N/A Psychology 21 $65,000 $24,000 $35,360 $38,043 $33,070 $32,909 $33,814 Religious Studies 2 $65,000 $25,000 $45,000 $45,000 $28,500 N/A $25,500 Sociology 6 $68,000 $31,000 $47,534 $47,595 $35,997 $27,141 $33,973 Statistics - Arts & Sciences 3 $68,000 $52,000 $55,000 $58,333 $73,000 $69,000 $42,965 Studio Art 2 $38,000 $26,000 $32,000 $32,000 $26,560 N/A $31,800 Sustainability 1 $40,000 $40,000 $40,000 $40,000 $50,000 N/A N/A Theatre 2 $33,280 $30,000 $31,640 $31,640 N/A N/A $19,500 Arts & Sciences 128 $139,000 $20,400 $41,000 $44,585 $38,224 $38,385 $37,477 College of Arts & Sciences Degree: Bachelor’s
2021-2022 ARTS & SCIENCES
UNIVERSITY OF TENNESSEE, KNOXVILLE | CAREER OUTCOMES REPORT | 2021-2022 24 College of Arts & Sciences Degree: Master’s
Numberof GraduatesNumberResponded Service/MilitaryContinuingEducation EmployedResponseRate SeekingEmploymentSeekingEducationNotSeeking Anthropology 7 6 86% 50% 0% 33.3% 0% 0% 16.7% Art 8 3 38% 100% 0% 0% 0% 0% 0% Biochemical, Cellular, & Molecular Biology 1 0 0% 0% 0% 0% 0% 0% 0% Chemistry 1 0 0% 0% 0% 0% 0% 0% 0% Ecology/Evolutionary Biology 4 4 100% 100% 0% 0% 0% 0% 0% English 20 14 70% 42.8% 0% 28.6% 21.4% 0% 7.1% French 1 0 0% 0% 0% 0% 0% 0% 0% Geography 7 6 86% 66.7% 0% 33.3% 0% 0% 0% Geology 5 3 60% 66.7% 0% 33.3% 0% 0% 0% History 8 6 75% 50% 0% 50% 0% 0% 0% Life Sciences 1 1 100% 0% 0% 100% 0% 0% 0% Mathematics 21 15 71% 46.7% 0% 53.3% 0% 0% 0% Microbiology 2 2 100% 50% 0% 50% 0% 0% 0% Modern Foreign Languages 4 3 75% 33.3% 0% 66.7% 0% 0% 0% Music 39 32 82% 56.2% 0% 34.4% 0% 0% 0% Philosophy 2 2 100% 100% 0% 0% 0% 0% 0%
2021-2022 ARTS & SCIENCES
UNIVERSITY OF TENNESSEE, KNOXVILLE | CAREER OUTCOMES REPORT | 2021-2022 25
Physics 13 11 85% 45.5% 0% 45.5% 0% 9.1% 0% Political Science 2 0 0% 0% 0% 0% 0% 0% 0% Psychology 8 8 100% 25% 0% 75% 0% 0% 0% Public Policy & Administration 16 14 88% 92.9% 7.1% 0% 0% 0% 0% Sociology 5 5 100% 60% 0% 40% 0% 0% 0% Theatre 2 1 50% 0% 0% 0% 100% 0% 0% Arts & Sciences 177 136 77% 56.6% <1% 35.3% 2.9% <1% 3.7%
Service/MilitaryContinuingEducation
SeekingEmployment
College of Arts & Sciences Degree: Master’s
Numberof GraduatesNumberResponded
EmployedResponseRate
SeekingEducationNotSeeking
2021-2022 ARTS & SCIENCES
UNIVERSITY OF TENNESSEE, KNOXVILLE | CAREER OUTCOMES REPORT | 2021-2022 26 College of Arts & Sciences Degree: Doctorate
Anthropology 2 2 100% 100% 0% 0% 0% 0% 0% Biochemical, Cellular, & Molecular Biology 8 6 75% 100% 0% 0% 0% 0% 0% Chemistry 21 16 76.1% 100% 0% 0% 0% 0% 0% Ecology & Evolutionary Biology 10 10 100% 100% 0% 0% 0% 0% 0% English 6 3 50% 100% 0% 0% 0% 0% 0% Geography 1 1 100% 100% 0% 0% 0% 0% 0% Geology 1 0 0% 0% 0% 0% 0% 0% 0% History 5 5 100% 100% 0% 0% 0% 0% 0% Life Sciences 4 4 100% 100% 0% 0% 0% 0% 0% Mathematics 13 5 38.4% 100% 0% 0% 0% 0% 0% Microbiology 9 7 77.7% 71.4% 0% 0% 14.3% 14.3% 0% Modern Foreign Languages 4 3 75% 66.7% 33.3% 0% 0% 0% 0% Philosophy 4 4 100% 100% 0% 0% 0% 0% 0% Physics 16 11 68.7% 90.9% 0% 0% 0% 0% 9.1% Numberof GraduatesNumberResponded Service/MilitaryContinuingEducation EmployedResponseRate SeekingEmploymentSeekingEducationNotSeeking
2021-2022 ARTS & SCIENCES
UNIVERSITY OF TENNESSEE, KNOXVILLE | CAREER OUTCOMES REPORT | 2021-2022 27
Political Science 8 7 87.5% 100% 0% 0% 0% 0% 0% Psychology 17 10 58.8% 80% 0% 0% 10% 0% 10% Sociology 2 1 50% 100% 0% 0% 0% 0% 0% Arts & Sciences 131 95 72.5% 93.7% 1.1% 0% 2.1% 1.1% 2.1% Numberof GraduatesNumberResponded Service/MilitaryContinuingEducation EmployedResponseRate SeekingEmploymentSeekingEducationNotSeeking College of Arts & Sciences Degree: Doctorate
UNIVERSITY OF TENNESSEE, KNOXVILLE | CAREER OUTCOMES REPORT | 2021-2022 28 Haslam College of Business Degree: Bachelor’s 2021-2022 BUSINESS Accounting 96 88 92% 30.6% 0% 61.7% 6.7% 0% 0% Business Administration 3 2 67% 100% 0% 0% 0% 0% 0% Business Analytics 179 167 93% 77.8% 1.2% 13.2% 6% 1.2% >1% Economics 29 28 97% 78.6% 3.6% 14.3% 3.6% 0% 0% Finance 187 176 94% 81.3% 1.7% 10.2% 4.5% 1.1% 1.1% Human Resource Management 39 38 97% 92.1% 0% 7.9% 0% 0% 0% Management 104 98 94% 81.6% 0% 6.1% 8.2% 0% 4.1% Marketing 239 217 91% 89% 1% 6.5% 2.8% 0% >1% Public Administration 12 12 100% 50% 0% 16.7% 25% 0% 8.3% Supply Chain Management 360 339 94% 88.2% 1.8% 4.4% 3.5% 1.2% >1% Haslam College of Business 1248 1165 93% 80.4% 1.2% 11.9% 4.6% >1% 1.1% Numberof GraduatesNumberResponded Service/MilitaryContinuingEducation EmployedResponseRate SeekingEmploymentSeekingEducationNotSeeking
UNIVERSITY OF TENNESSEE, KNOXVILLE | CAREER OUTCOMES REPORT | 2021-2022 29
Accounting 12 $100,000 $30,000 $54,580 $55,717 $53,854 $53,161 $52,911 Business Administration 0 $0 $0 $0 $0 N/A N/A N/A Business Analytics 63 $120,000 $37,000 $65,000 $64,405 $59,868 $56,200 $57,642 Economics 13 $84,000 $33,000 $61,000 $59,717 $48,636 $48,650 $51,786 Finance 77 $175,000 $24,000 $60,000 $63,494 $51,453 $52,357 $47,942 Human Resource Management 16 $75,000 $29,120 $54,000 $53,698 $57,208 $50,710 $43,400 Management 45 $90,000 $20,000 $50,000 $50,890 $56,590 $44,811 $46,774 Marketing 78 $100,000 $24,000 $50,000 $50,598 $46,627 $46,251 $45,350 Public Administration 2 $66,000 $55,000 $60,500 $60,500 $44,750 N/A $50,000 Supply Chain Management 198 $100,000 $30,000 $60,000 $59,474 $55,901 $57,691 $54,175 Haslam College of Business 504 $175,000 $20,000 $58,805 $58,302 $53,868 $53,226 $51,380
Haslam College of Business Degree: Bachelor’s
2021-2022 BUSINESS
NumberofSalariesSalaryHigh SalaryMean2021-2022SalaryMedian SalaryLow Mean2020-2021Mean2019-2020Mean2018-2019
UNIVERSITY OF TENNESSEE, KNOXVILLE | CAREER OUTCOMES REPORT | 2021-2022 30 Haslam College of Business Degree: Master’s
BUSINESS Accounting 105 60 57% 98.4% 0% 0% 1.7% 0% 0% Business Administration 50 50 100% 74% 0% 0% 6% 0% 20% Business Analytics 29 29 100% 96% 0% 0% 3% 0% 3% Economics 5 5 100% 20% 0% 80% 0% 0% 0% Human Resource Management 13 5 38% 60% 0% 0% 0% 20% 20% Supply Chain Management 71 26 37% 92.3% 3.8% 0% 3.8% 0% 0% Haslam College of Business 273 175 64% 86.2% <1% 2.2% 3.4% <1% 6.8% Numberof GraduatesNumberResponded Service/MilitaryContinuingEducation EmployedResponseRate SeekingEmploymentSeekingEducationNotSeeking Business Administration 8 8 100% 100% 0% 0% 0% 0% 0% Business Analytics 3 3 100% 100% 0% 0% 0% 0% 0% Economics 3 2 66.6% 100% 0% 0% 0% 0% 0% Haslam College of Business 14 13 92.8% 100% 0% 0% 0% 0% 0% Degree: Doctorate
2021-2022


UNIVERSITY OF TENNESSEE, KNOXVILLE | CAREER OUTCOMES REPORT | 2021-2022 31
UNIVERSITY OF TENNESSEE, KNOXVILLE | CAREER OUTCOMES REPORT | 2021-2022 32 College of Communication & Information Degree: Bachelor’s 2021-2022 COMM & INFO Advertising 48 47 98% 80.8% 0% 6.4% 12.8% 0% 0% Communication Studies 136 117 86% 63.2% 0% 7.7% 20.5% 1.7% 6.8% Information Sciences 11 8 73% 62.5% 0% 12.5% 12.5% 12.5% 0% Journalism & Electronic Media 81 62 77% 79% 0% 6.5% 11.3% 0% 3.2% Public Relations 78 66 85% 75.7% 0% 16.7% 6.1% 0% 1.5% Communication & Information 354 300 85% 72% 0% 9.3% 14% 1% 3.7% Numberof GraduatesNumberResponded Service/MilitaryContinuingEducation EmployedResponseRate SeekingEmploymentSeekingEducationNotSeeking
UNIVERSITY OF TENNESSEE, KNOXVILLE | CAREER OUTCOMES REPORT | 2021-2022 33
COMM & INFO NumberofSalariesSalaryHigh SalaryMean2021-2022SalaryMedian SalaryLow Mean2020-2021Mean2019-2020Mean2018-2019 Advertising 8 $58,000 $24,000 $46,500 $45,625 $41,666 $42,786 $35,725 Communication Studies 24 $66,306 $22,880 $45,000 $44,279 $51,500 $36,000 $39,567 Information Sciences 0 N/A N/A N/A N/A N/A N/A N/A Journalism & Electronic Media 7 $46,500 $30,000 $36,000 $38,170 $40,540 $41,455 $30,300 Public Relations 13 $65,000 $31,200 $50,000 $48,468 $46,616 $50,000 $39,767 Communication & Information 52 $66,306 $22,880 $45,000 $44,711 $45,059 $42,231 $36,807 College of Communication & Information Degree: Bachelor’s
2021-2022
UNIVERSITY OF TENNESSEE, KNOXVILLE | CAREER OUTCOMES REPORT | 2021-2022 34 2021-2022 COMM & INFO College of Communication & Information Degree: Master’s Advertising 8 8 100% 62.5% 0% 0% 12.5% 0% 25% Advertising & Public Relations 3 3 100% 100% 0% 0% 0% 0% 0% Communication Studies 4 4 100% 75% 0% 0% 0% 0% 25% Information Sciences 127 78 61% 87.2% 0% 1.3% 7.7% 2.6% 1.3% Journalism & Electronic Media 9 6 67% 83.3% 0% 0% 16.7% 0% 0% Public Relations 6 6 100% 100% 0% 0% 0% 0% 0% Strategic & Digital Communications 4 4 100% 100% 0% 0% 0% 0% 0% Communication & Information 161 109 68% 86.2% 0% <1% 7.3% 1.8% 3.7% Numberof GraduatesNumberResponded Service/MilitaryContinuingEducation EmployedResponseRate SeekingEmploymentSeekingEducationNotSeeking
UNIVERSITY OF TENNESSEE, KNOXVILLE | CAREER OUTCOMES REPORT | 2021-2022 35 2021-2022 COMM & INFO College of Communication & Information Degree: Doctorate Communication Studies 4 3 75% 100% 0% 0% 0% 0% 0% Information Sciences 2 2 100% 50% 0% 0% 0% 0% 50% Communication & Information 6 5 83.3% 80% 0% 0% 0% 0% 20% Numberof GraduatesNumberResponded Service/MilitaryContinuingEducation EmployedResponseRate SeekingEmploymentSeekingEducationNotSeeking
UNIVERSITY OF TENNESSEE, KNOXVILLE | CAREER OUTCOMES REPORT | 2021-2022 36 College of Education, Health & Human Sciences Degree: Bachelor’s 2021-2022 EHHS Audiology & Speech Pathology 73 57 78% 14% 0% 84.2% 0% 1.8% 0% Child & Family Studies 84 67 80% 41.8% 1.5% 50.7% 4.5% 1.5% 0% Hotel, Restaurant, & Tourism 34 28 82% 92.9% 0% 7.1% 0% 0% 0% Kinesiology 232 164 71% 34.2% 0% 53% 3% 7.9% 1.8% Nutrition 19 17 89% 11.8% 5.9% 82.4% 0% 0% 0% Recreation & Sport Management 119 105 88% 52.3% 0% 33.3% 7.4% <1% 4.6% Retail & Consumer Sciences 30 27 90% 92.6% 0% 0% 3.7% 0% 3.7% Special Education 19 18 95% 16.7% 0% 83.3% 0% 0% 0% Sport Management 2 2 100% 50% 0% 0% 50% 0% 0% Therapeutic Recreation 4 3 75% 33.3% 0% 66.7% 0% 0% 0% Education, Health, & Human Sciences 616 488 79% 42% <1% 48.5% 3.7% 3.3% 1.8% Numberof GraduatesNumberResponded Service/MilitaryContinuingEducation EmployedResponseRate SeekingEmploymentSeekingEducationNotSeeking
UNIVERSITY OF TENNESSEE, KNOXVILLE | CAREER OUTCOMES REPORT | 2021-2022 37
EHHS Audiology & Speech Pathology 3 $54,000 $33,280 $50,000 $45,760 $28,000 $30,000 $30,600 Child & Family Studies 5 $55,000 $40,000 $41,600 $43,920 $35,404 $19,760 $27,984 Hotel, Restaurant, & Tourism 8 $46,500 $31,200 $38,720 $38,763 $41,500 N/A N/A Kinesiology 14 $55,000 $24,960 $40,800 $39,090 $38,167 $29,267 $42,124 Nutrition 0 $0 $0 $0 $0 $33,613 $28,923 $31,391 Recreation & Sport Management 14 $55,000 $27,000 $40,000 $40,740 $25,300 N/A $41,195 Retail & Consumer Sciences 7 $65,000 $29,120 $50,000 $49,874 N/A N/A N/A Special Education 2 $47,320 $45,000 $46,160 $46,160 $43,927 $31,457 $30,543 Sport Management 1 $36,400 $36,400 $36,400 $36,400 $38,900 $57,000 $41,407 Teacher Education 1 $38,000 $38,000 $38,000 $38,000 $39,000 $29,120 N/A Education, Health, & Human Sciences 55 $65,000 $24,960 $40,000 $41,826 N/A N/A N/A NumberofSalariesSalaryHigh SalaryMean2021-2022SalaryMedian SalaryLow Mean2020-2021Mean2019-2020Mean2018-2019 College of Education, Health & Human Sciences Degree: Bachelor’s
2021-2022
UNIVERSITY OF TENNESSEE, KNOXVILLE | CAREER OUTCOMES REPORT | 2021-2022 38 College of Education, Health & Human Sciences Degree: Master’s 2021-2022 EHHS Child & Family Studies 11 6 55% 83.3% 0% 16.7% 0% 0% 0% College Student Personnel 20 17 85% 88.2% 0% 11.8% 0% 0% 0% Counseling 22 16 73% 93.8% 0% 0% 6.2% 0% 0% Education 16 8 50% 100% 0% 0% 0% 0% 0% Educational Administration 12 8 67% 100% 0% 0% 0% 0% 0% Educational Leadership 1 1 100% 100% 0% 0% 0% 0% 0% Educational Psychology 19 18 95% 83.3% 0% 16.7% 0% 0% 0% Kinesiology 21 13 62% 94% 0% 0% 0% 0% 0% Nutrition 21 16 76% 100% 0% 0% 0% 0% 0% Public Health 27 23 85% 56.5% 0% 39.1% 0% 4.3% 0% Recreation & Sport Management 23 16 70% 100% 0% 0% 0% 0% 0% Teacher Education 110 45 41% 80% 0% 15.6% 4.4% 0% 0% Education, Health, & Human Sciences 303 187 62% 86.1% 0% 11.8% 1.6% <1% 0% Numberof GraduatesNumberResponded Service/MilitaryContinuingEducation EmployedResponseRate SeekingEmploymentSeekingEducationNotSeeking
UNIVERSITY OF TENNESSEE, KNOXVILLE | CAREER OUTCOMES REPORT | 2021-2022 39 2021-2022 EHHS Counselor Education 7 6 85.7% 100% 0% 0% 0% 0% 0% Education 16 14 87.5% 100% 0% 0% 0% 0% 0% Educational Psychology & Research 9 8 88.8% 100% 0% 0% 0% 0% 0% Higher Education Administration 4 4 100% 100% 0% 0% 0% 0% 0% Kinesiology & Sport Studies 9 7 77.7% 100% 0% 0% 0% 0% 0% Nutrition 4 2 50% 50% 0% 0% 0% 50% 0% Retail, Hospitality, & Tourism Management 2 2 100% 100% 0% 0% 0% 0% 0% School Psychology 6 2 33.3% 100% 0% 0% 0% 0% 0% Education, Health, & Human Sciences 57 45 78.9% 97.8% 0% 0% 0% 2.2% 0% Numberof GraduatesNumberResponded Service/MilitaryContinuingEducation EmployedResponseRate SeekingEmploymentSeekingEducationNotSeeking College of Education, Health & Human Sciences Degree: Doctorate
UNIVERSITY OF TENNESSEE, KNOXVILLE | CAREER OUTCOMES REPORT | 2021-2022 40 Tickle College of Engineering Degree: Bachelor’s
ENGINEERING Aerospace Engineering 54 46 85% 43.5% 6.5% 39.1% 8.7% 0% 2.2% Biomedical Engineering 63 54 86% 44.4% 0% 35.2% 14.8% 5.6% 0% Chemical Engineering 64 53 83% 66% 0% 26.4% 7.5% 0% 0% Civil Engineering 66 62 94% 67.7% 1.6% 22.6% 3.2% 4.8% 0% Computer Engineering 19 16 84% 62.5% 0% 31.2% 6.2% 0% 0% Computer Science 79 72 91% 68.1% 0% 26.4% 5.6% 0% 0% Electrical Engineering 44 36 82% 66.7% 5.6% 22.2% 5.6% 0% 0% Industrial Engineering 43 41 95% 85.4% 0% 9.8% 2.4% 0% 2.4% Materials Science & Engineering 19 18 95% 38.9% 0% 55.6% 0% 0% 5.6% Mechanical Engineering 185 154 83% 79.8% <1% 15.6% 3.2% <1% 0% Nuclear Engineering 40 38 95% 36.8% 5.2% 52.6% 5.3% 0% 0% Tickle College of Engineering 676 590 87% 64.9% 1.6% 26.3% 5.6% 1.2% <1% Numberof GraduatesNumberResponded Service/MilitaryContinuingEducation EmployedResponseRate SeekingEmploymentSeekingEducationNotSeeking
2021-2022
UNIVERSITY OF TENNESSEE, KNOXVILLE | CAREER OUTCOMES REPORT | 2021-2022 41
Aerospace Engineering 7 $83,000 $50,000 $67,000 $65,507 $58,230 $67,500 $66,324 Biomedical Engineering 12 $100,000 $41,760 $71,000 $67,793 $56,400 $55,000 $49,760 Chemical Engineering 20 $87,000 $47,840 $72,936 $71,262 $70,074 $74,409 $65,031 Civil Engineering 24 $76,000 $31,000 $65,000 $63,729 $53,956 $58,191 $57,606 Computer Engineering 6 $118,000 $72,000 $93,000 $92,667 $73,875 $66,333 $69,403 Computer Science 18 $129,000 $50,000 $69,500 $79,332 $76,412 $69,131 $77,227 Electrical Engineering 12 $83,000 $48,978 $74,000 $72,165 $69,144 $62,271 $69,892 Industrial Engineering 19 $88,000 $62,500 $70,000 $71,049 $68,324 $67,118 $68,063 Materials Science & Engineering 3 $91,327 $57,990 $77,000 $75,439 $69,800 $62,000 $51,000 Mechanical Engineering 67 $89,000 $32,000 $72,000 $70,416 $64,858 $68,400 $65,865 Nuclear Engineering 8 $82,000 $60,320 $71,500 $71,728 $72,250 $70,740 $68,243 Tickle College of Engineering 196 $129,000 $31,000 $70,000 $71,146 $65,836 $66,302 $65,807
SalaryHigh SalaryMean2021-2022SalaryMedian SalaryLow Mean2020-2021Mean2019-2020Mean2018-2019 Tickle College of Engineering Degree: Bachelor’s
2021-2022 ENGINEERING
NumberofSalaries
UNIVERSITY OF TENNESSEE, KNOXVILLE | CAREER OUTCOMES REPORT | 2021-2022 42 Tickle College of Engineering Degree: Master’s
ENGINEERING Aerospace Engineering 13 7 54% 71.4% 0% 14.3% 14.3% 0% 0% Biomedical Engineering 3 3 100% 33.3% 0% 66.7% 0% 0% 0% Chemical Engineering 2 2 100% 50% 0% 50% 0% 0% 0% Civil Engineering 25 21 84% 90.5% 0% 9.5% 0% 0% 0% Computer Engineering 4 3 75% 33.3% 0% 66.7% 0% 0% 0% Computer Science 28 19 68% 89.5% 0% 10.5% 0% 0% 10% Electrical Engineering 19 16 84% 68.8% 0% 31.2% 0% 0% 0% Environmental Engineering 5 4 80% 75% 0% 25% 0% 0% 0% Industrial Engineering 32 19 59% 73.7% 0% 15.8% 10.5% 0% 0% Materials Science & Engineering 9 8 89% 12.5% 0% 87.5% 0% 0% 0% Mechanical Engineering 27 22 81% 81.8% 0% 13.6% 4.5% 0% 0% Medical Physics 3 2 67% 100% 0% 0% 0% 0% 0% Nuclear Engineering 20 12 60% 33.3% 0% 58.3% 0% 0% 8.3% Reliability & Maintainability 5 2 40% 100% 0% 0% 0% 0% 0% Tickle College of Engineering 195 140 72% 70.7% 0% 25.7% 2.9% 0% <1%
Service/MilitaryContinuingEducation
ResponseRate SeekingEmploymentSeekingEducationNotSeeking
2021-2022
Numberof GraduatesNumberResponded
Employed
UNIVERSITY OF TENNESSEE, KNOXVILLE | CAREER OUTCOMES REPORT | 2021-2022 43 Tickle College of Engineering Degree: Doctorate
ENGINEERING Aerospace Engineering 2 0 0% 0% 0% 0% 0% 0% 0% Biomedical Engineering 2 1 50% 100% 0% 0% 0% 0% 0% Chemical Engineering 6 4 66.6% 100% 0% 0% 0% 0% 0% Civil Engineering 11 8 72.7% 87.5% 0% 0% 12.5% 0% 0% Computer Engineering 6 5 83.3% 100% 0% 0% 0% 0% 0% Computer Science 6 3 50% 100% 0% 0% 0% 0% 0% Electrical Engineering 14 10 71.4% 100% 0% 0% 0% 0% 0% Engineering Science 2 0 0% 0% 0% 0% 0% 0% 0% Industrial Engineering 10 9 90% 66.7% 0% 0% 0% 11.1% 22.2% Materials Science & Engineering 17 15 88.2% 100% 0% 0% 0% 0% 0% Mechanical Engineering 12 7 58.3% 85.7% 0% 0% 0% 14.3% 0% Nuclear Engineering 16 12 75% 91.7% 0% 0% 8.3% 0% 0% Tickle College of Engineering 104 74 71.1% 91.9% 0% 0% 2.7% 2.7% 2.7% Numberof GraduatesNumberResponded Service/MilitaryContinuingEducation EmployedResponseRate SeekingEmploymentSeekingEducationNotSeeking %
2021-2022
UNIVERSITY OF TENNESSEE, KNOXVILLE | CAREER OUTCOMES REPORT | 2021-2022 44 College of Nursing Degree: Bachelor’s 2021-2022 NURSING Nursing 30 28 100% 100% 0% 0% 0% 0% 0% Numberof GraduatesNumberResponded Service/MilitaryContinuingEducation EmployedResponseRate SeekingEmploymentSeekingEducationNotSeeking Degree: Doctorate Nursing 20 14 70% 100% 0% 0% 0% 0% 0% Numberof GraduatesNumberResponded Service/MilitaryContinuingEducation EmployedResponseRate SeekingEmploymentSeekingEducationNotSeeking Degree: Master’s Nursing 257 213 83% 90.6% <1% <1% 6.6% <1% 1.4% Numberof GraduatesNumberResponded Service/MilitaryContinuingEducation EmployedResponseRate SeekingEmploymentSeekingEducationNotSeeking Nursing 125 $108,000 $43,200 $60,000 $58,664 $49,520 $44,785 $42,948 NumberofSalariesSalaryHigh SalaryMean2021-2022SalaryMedian SalaryLow Mean2020-2021Mean2019-2020Mean2018-2019 Degree: Bachelor’s
UNIVERSITY OF TENNESSEE, KNOXVILLE | CAREER OUTCOMES REPORT | 2021-2022 45
SOCIAL
Social Work 21 14 66.6% 92.9% 0% 0% 0% 0% 7.1% Numberof GraduatesNumberResponded Service/MilitaryContinuingEducation EmployedResponseRate SeekingEmploymentSeekingEducationNotSeeking Degree: Doctorate Social Work 243 93 38.2% 97.9% 0% 0% 2.2% 0% 0% Numberof GraduatesNumberResponded Service/MilitaryContinuingEducation EmployedResponseRate SeekingEmploymentSeekingEducationNotSeeking Degree: Master’s Social Work 73 66 90% 24.2% 0% 66.7% 6.1% 1.5% 1.5% Numberof GraduatesNumberResponded Service/MilitaryContinuingEducation EmployedResponseRate SeekingEmploymentSeekingEducationNotSeeking Social Work 6 $42,000 $22,000 $32,000 $31,667 $29,760 $50,000 $30,207 NumberofSalariesSalaryHigh SalaryMean2021-2022SalaryMedian SalaryLow Mean2020-2021Mean2019-2020Mean2018-2019 Degree: Bachelor’s College of Social Work Degree: Bachelor’s
2021-2022
WORK
UNIVERSITY OF TENNESSEE, KNOXVILLE | CAREER OUTCOMES REPORT | 2021-2022 46
INTERCOLLEGIATE Comparative & Experimental Medicine 3 2 67% 50% 0% 50% 0% 0% 0% Numberof GraduatesNumberResponded Service/MilitaryContinuingEducation EmployedResponseRate SeekingEmploymentSeekingEducationNotSeeking Comparative & Experimental Medicine 3 0 0% 100% 0% 0% 0% 0% 0% Data Science & Engineering 3 2 66.6% 100% 0% 0% 0% 0% 0% Energy Science & Engineering 19 18 94.7% 94.4% 0% 0% 5.6% 0% 0% Intercollegiate 25 23 92% 95.7% 0% 0% 4.3% 0% 0% Numberof GraduatesNumberResponded Service/MilitaryContinuingEducation EmployedResponseRate SeekingEmploymentSeekingEducationNotSeeking Degree: Doctorate Degree: Master’s
2021-2022
