LABOR AND CONCLUSION
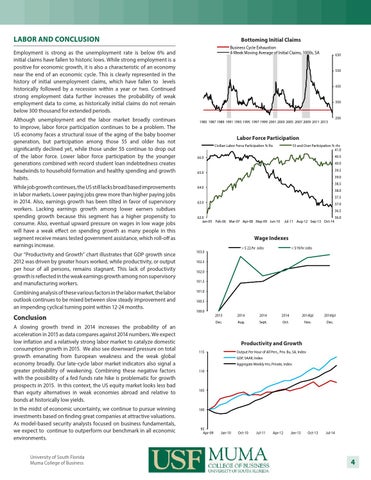
Bottoming Initial Claims Business Cycle Exhaustion 4-Week Moving Average of Initial Claims, 1000s, SA
Employment is strong as the unemployment rate is below 6% and initial claims have fallen to historic lows. While strong employment is a positive for economic growth, it is also a characteristic of an economy near the end of an economic cycle. This is clearly represented in the history of initial unemployment claims, which have fallen to levels historically followed by a recession within a year or two. Continued strong employment data further increases the probability of weak employment data to come, as historically initial claims do not remain below 300 thousand for extended periods. Although unemployment and the labor market broadly continues to improve, labor force participation continues to be a problem. The US economy faces a structural issue of the aging of the baby boomer generation, but participation among those 55 and older has not significantly declined yet, while those under 55 continue to drop out of the labor force. Lower labor force participation by the younger generations combined with record student loan indebtedness creates headwinds to household formation and healthy spending and growth habits.
550
450
350
Labor Force Participation Civilian Labor Force Participation % lhs
40.0 39.5 39.0
103.0
Combining analysis of these various factors in the labor market, the labor outlook continues to be mixed between slow steady improvement and an impending cyclical turning point within 12-24 months.
101.0
University of South Florida Muma College of Business
40.5
65.0
Our “Productivity and Growth� chart illustrates that GDP growth since 2012 was driven by greater hours worked, while productivity, or output per hour of all persons, remains stagnant. This lack of productivity growth is reflected in the weak earnings growth among non supervisory and manufacturing workers.
In the midst of economic uncertainty, we continue to pursue winning investments based on finding great companies at attractive valuations. As model-based security analysts focused on business fundamentals, we expect to continue to outperform our benchmark in all economic environments.
55 and Over Participation % rhs 41.0
66.0
64.0
A slowing growth trend in 2014 increases the probability of an acceleration in 2015 as data compares against 2014 numbers. We expect low inflation and a relatively strong labor market to catalyze domestic consumption growth in 2015. We also see downward pressure on total growth emanating from European weakness and the weak global economy broadly. Our late-cycle labor market indicators also signal a greater probability of weakening. Combining these negative factors with the possibility of a fed funds rate hike is problematic for growth prospects in 2015. In this context, the US equity market looks less bad than equity alternatives in weak economies abroad and relative to bonds at historically low yields.
250
1985 1987 1989 1991 1993 1995 1997 1999 2001 2003 2005 2007 2009 2011 2013
While job growth continues, the US still lacks broad based improvements in labor markets. Lower paying jobs grew more than higher paying jobs in 2014. Also, earnings growth has been tilted in favor of supervisory workers. Lacking earnings growth among lower earners subdues spending growth because this segment has a higher propensity to consume. Also, eventual upward pressure on wages in low wage jobs will have a weak effect on spending growth as many people in this segment receive means tested government assistance, which roll-off as earnings increase.
Conclusion
650
38.5 38.0 37.5
63.0
37.0 36.5
62.0 Jan-05 Feb-06 Mar-07 Apr-08 May-09 Jun-10
Jul-11 Aug-12 Sep-13 Oct-14
36.0
Wage Indexes > $ 22/hr Jobs
< $19/hr Jobs
102.5 102.0 101.5
100.5 100.0
2013
2014
2014
2014
2014(p)
2014(p)
Dec.
Aug.
Sept.
Oct.
Nov.
Dec.
Productivity and Growth 115
Output Per Hour of All Pers., Priv. Bu, SA, Index GDP, SAAR, Index Aggregate Weekly Hrs, Private, Index
110
105
100
95 Apr-09
Jan-10
Oct-10
Jul-11
Apr-12
Jan-13
Oct-13
Jul-14
4