4 minute read
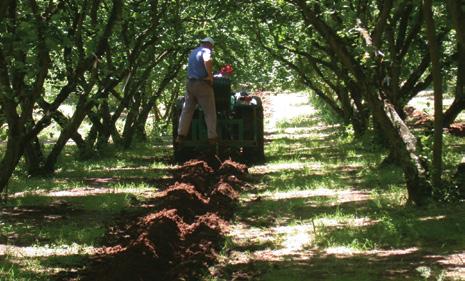
PREHARVEST ACTIVITIES

Estimation of production (flowers and fruit counting) 2.1.
The estimation of production obtainable from a hazelnut orchard can be a difficult task to perform. The main cultivated varieties in Europe can be considered cultivars selected from the wild, that maintain certain inhomogeneity within them. However, planting material coming from accredited nurseries, with a certification on both the varietal identity and the phytosanitary status, should display a better homogeneity.
Advertisement
The aim is to provide an early yield estimation by means of conducting flower and fruit counts at several representative sampling locations within each parcel. Detailed information about the sampling locations, such as age, variety, planting density, yield levels, should always be recorded. Orchard owners or local agronomists can conduct the sampling. At each sampling location, a minimum of six trees has to be randomly selected for sampling. Trees along the orchard perimeter are excluded since they are often affected by external factors and do not fully reflect the growing conditions at the sampling location. With random selection of trees, it will be avoided any bias due to the productivity of a tree.
If a sampling location is large and/or heterogeneous or it is planted with different varieties, it is strongly recommended to subsample the parcel, by selecting points at different cardinal directions.
The purpose of the subsampling is to obtain the most representative estimation of the orchard yield.
In the below examples, a minimum of six subsampling locations has to be defined within the perimeter of a large sampling location, where three cultivars are grown (Example 1) or a minimum of three subsampling for orchard with one main cultivar (Example 2).
Moreover, if multiple varieties are grown in small orchards, minimum one subsampling point per variety may be selected (Example 3).
EXAMPLE 3
• Small orchard (9 ha)
• Three main cultivars
• 3 Sub-sampling locations
At each of these subsampling locations a minimum of six trees will be randomly selected for crop counting. The number of subsampling locations depends on the accuracy that a farmer desires. This strategy ensures that differing yield levels of the selected varieties are considered for the final yield forecast.
Once the trees for sampling are randomly selected, two different crop counting approaches may be applied depending on the age of the trees:
• Tree is younger than five years: if a tree is still young, the crop counting shall be performed on the entire tree. In the final automated yield forecasting step, the average number of healthy nuts per tree will be calculated and used to estimate yield. Once a tree becomes taller than 1.80 m, the sampling of the entire tree becomes very tedious. In this case, the procedure for trees older than five years (see below) shall be followed.
EXAMPLE 1
• Large orchard (22 ha)
• Three main cultivars
• 6 sub-sampling locations
• 6 plants per location
• Tree is older than five years: if a tree is (or close to be) mature, the crop counting shall be performed on one entire, healthy branch per tree. An entire branch in this context refers to the entirety of second and third level branches diverting from one first level branch (stem) in the diagram (Fig. 2.1).
EXAMPLE 2
• Large orchard (22 ha)
• One main cultivar
• 3 sub-sampling locations
• 6 plants per location
1.level
2.level
3.level
The amount of light and shade (from the adjacent trees) varies in different cardinal directions and heights of the tree, so does the productivity of the selected tree. By means of sampling an entire healthy branch from bottom to top, the height effect is automatically accounted for. To account for the effect of the orientation of a branch, the branches should be sampled in different cardinal directions for each selected tree. For example, on the first selected tree the counting can be conducted on a branch facing south. On the second tree, a branch facing west should be selected, and so on. This strategy is systematically depicted in Figure 2.2.

2. Nut clusters counting (May-June). Nut clusters are counted. If flower count was not performed in February-March, the sampled branch/tree is marked, so that it can be counted again during the next counting within the same growing season. The count of the nut clusters is normally more reliable than flower count as it takes place after the period in which yields might be negatively affected by late frost.
The estimation of production potential could be performed in three different period of the fruit development:

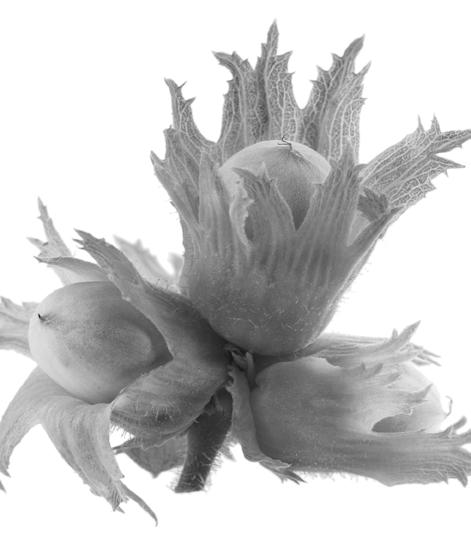
1. Flower count (February-March). Depending on the exact date of the sampling campaign and the visibility of the female flower development, all flowers showing pistils in varying shades from light pink to brownish, as shown in the picture below, will be counted. Upon the completion of the flower count, the sampled branch will be marked, so that it can be counted again during the next counting within the same growing season.
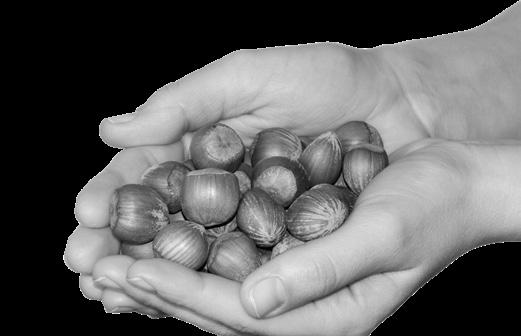
3.Single nuts count (mid-July - early August). All individual nuts are counted. This count provides the most certain estimation because it is performed close to harvest time. Also, trees should have already passed the period in which early dropping of infructescence may occur. This phenomenon is still under investigation, but one of the main causes could be the lack of fertilization due to multiple factors including lack of nutritional elements, adverse climate conditions during late May/early June, when fertilization generally occurs, and the presence of genetic abnormalities in some cultivars. Other causes of early drop can be the attacks by bugs or other insects on young nuts.
Planning of pre-harvest and harvest on the basis of estimation of production 2.2.
Planning correctly pre-harvest and harvest operations is the best way to save time and money, as well as to maintain a high quality of production by collecting the fruits in time thus avoiding its long stay on the ground. The major assumptions for planning are based on yield estimation and on the typical machinery and equipment used in the farm to perform pre-harvest and harvest operations.
Yield estimation (Fig. 2.6). For a hazelnut grove made with good quality plants, the first production is obtained in the fourth year of planting and productivity increases until the10-12th year, then becomes almost steady for the following years.

Machinery and equipment. The major assumptions used in developing the plan are:
• Machinery efficiency: average data considering one working shift (8h)
• Harvest period: thir ty harvesting days
• Harvest machine: one harvest machine is needed for every 100 ha of hazelnut grove as well as one mechanical blower and four manual blowers per harvest machine
• Trailers: one for each harvest machine; however, the total number of trailers and their capacity strongly depend on the logistic organization and strategy applied by each farmer. The factor that mostly influence the plan is the size of the farm (Table 2.1).
All the proposed solutions are just indicative and based on average conditions. A farmer has to adjust the procurement plan and select the proper machine based on different parameters such as growth, soil management, average weather conditions at the parcels, strategy process flow of the operations, etc.