Rankings Based on Publications and Citations Figure 6.5a Number of Engineering Publications Indexed by Thomson Reuters for Association of American Universities (AAU) Public and Canadian Peer Institutions, 2011 to 2015 5,218 3,968 3,802 3,771 3,712 3,523 3,397
Publications per Faculty
Rank on Pub per Faculty
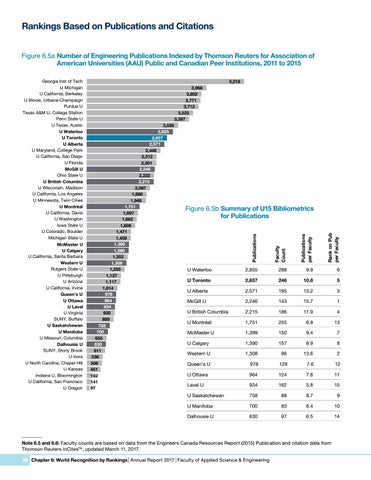
Figure 6.5b Summary of U15 Bibliometrics for Publications
Faculty Count
3,026 2,855 2,657 2,571 2,446 2,312 2,301 2,246 2,232 2,215 2,097 1,986 1,948 1,751 1,697 1,662 1,606 1,471 1,459 1,399 1,390 1,352 1,308 1,255 1,137 1,117 1,014 978 964 934 920 889 758 700 650 630 611 536 506 451 182 141 97
Publications
Georgia Inst of Tech U Michigan U California, Berkeley U Illinois, Urbana-Champaign Purdue U Texas A&M U, College Station Penn State U U Texas, Austin U Waterloo Waterloo U U Toronto Toronto U U Alberta Alberta U U Maryland, College Park U California, San Diego U Florida McGill U McGill Ohio State U British Columbia Columbia UUBritish U Wisconsin, Madison U California, Los Angeles U Minnesota, Twin Cities Montréal UU Montréal U California, Davis U Washington Iowa State U U Colorado, Boulder Michigan State U McMaster U McMaster U Calgary Calgary U U California, Santa Barbara Western U Western Rutgers State U U Pittsburgh U Arizona U California, Irvine Queens U Queen's U Ottawa Ottawa U Laval U U Laval U Manitoba U Virginia SUNY, Buffalo Saskatchewan UUSaskatchewan U Manitoba Manitoba U U Missouri, Columbia Dalhousie U Dalhousie SUNY, Stony Brook U Iowa U North Carolina, Chapel Hill U Kansas Indiana U, Bloomington U California, San Francisco U Oregon
U Waterloo
2,855
288
9.9
6
U Toronto
2,657
246
10.8
5
U Alberta
2,571
195
13.2
3
McGill U
2,246
143
15.7
1
U British Columbia
2,215
186
11.9
4
U Montréal
1,751
255
6.9
13
McMaster U
1,399
150
9.4
7
U Calgary
1,390
157
8.9
8
Western U
1,308
96
13.6
2
Queen’s U
978
129
7.6
12
U Ottawa
964
124
7.8
11
Laval U
934
162
5.8
15
U Saskatchewan
758
88
8.7
9
83
8.4
10
97
6.5
14
U Manitoba 700 Figure 6.5a U 630 Number of Engineering Publications IndexedDalhousie by Thomson Reuters Association of American Universities (AAU) Public and Canadian Peer Institutions, 2011 to 2015
Note 6.5 and 6.6: Faculty counts are based on data from the Engineers Canada Resources Report (2015) Publication and citation data from Thomson Reuters InCitesTM, updated March 11, 2017.
Chapter: Ch.6 - Rankings Figure 6.5b Excel Filename: 6.5+6.6 - Engineering Bibliometrics 2011 to 2015 (AR17 6.5+6.6) v2.xlsx Summary of -U15 Bibliometrics for P Sheet: 6.5a
90 Chapter 6: World Recognition by Rankings | Annual Report 2017 | Faculty of Applied Science & Engineering