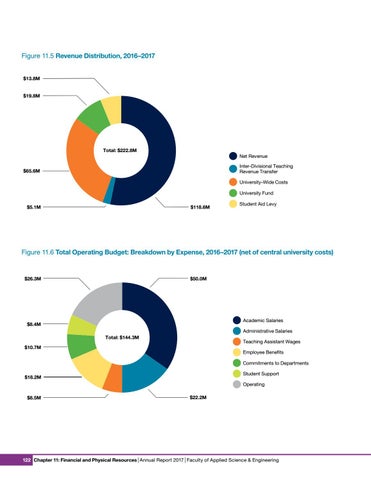
Figure 11.5 Revenue Distribution, 2016–2017 $13.8M $19.8M
Total: $222.8M Net Revenue Inter-Divisional Teaching Revenue Transfer
$65.6M
University-Wide Costs University Fund $5.1M
$118.6M
Student Aid Levy
Figure 11.6 Total Operating Budget: Breakdown by Expense, 2016–2017 (net of central university costs) Figure 11.5 Revenue Distribution, 2016–2017 $26.3M
Chapter: Excel Filename: Sheet: Date: Prepared by:
$50.0M
Ch.11 - Financial & Physical Resources 11.1-6 - Finances - FY17 (AR17 11.1-6) - v5.xlsx 11.5 July 18, 2017 Geoff Wichert
$8.4M
Academic Salaries Administrative Salaries
$10.7M
Total: $222.8M
Total: $144.3M
Teaching Assistant Wages Employee Benefits
Legend Labels: Net Revenue Inter-Divisional Teaching Revenue Transfer University-Wide Costs University Fund Contribution for Redistribution $8.5M Student Aid Levy
Commitments to Departments Student Support
$18.2M
122
Operating $22.2M
Figure 11.6 Total Net Operating Budget: Breakdown by Expense, 2016–2017 (net| Annual of central costs) Chapter 11: Financial and Physical Resources Report university 2017 | Faculty of Applied Science & Engineering