Yearbook of the United Nations, 2009
32 Goal 8 Develop a global partnership for development Target 8.A
Develop further an open, rule-based, predictable, non-discriminatory trading and financial system Includes a commitment to good governance, development and poverty reduction—both nationally and internationally
Target 8.B
Address the special needs of the least developed countries Includes: tariff- and quota-free access for the least developed countries’ exports; enhanced programme of debt relief for heavily indebted poor countries (hipc) and cancellation of official bilateral debt; and more generous official development assistance (oda) for countries committed to poverty reduction
Target 8.C
Address the special needs of landlocked developing countries and small island developing States (through the Programme of Action for the Sustainable Development of Small Island Developing States and the outcome of the twenty-second special session of the General Assembly)
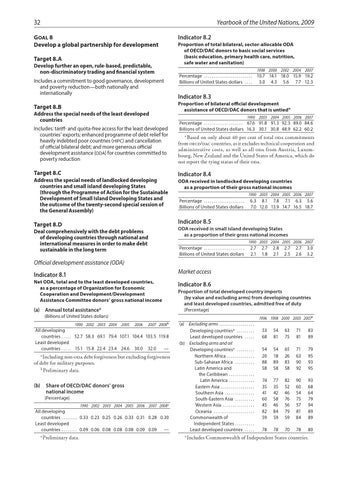
Indicator 8.2 Proportion of total bilateral, sector-allocable ODA of OECD/DAC donors to basic social services (basic education, primary health care, nutrition, safe water and sanitation) 1998 2000
Percentage . . . . . . . . . . . . . . . . . . . . . . . . . Billions of United States dollars . . . . .
2002 2004
2007
10.7 14.1 18.0 15.9 19.2 3.0 4.3 5.6 7.7 12.3
Indicator 8.3 Proportion of bilateral official development assistance of OECD/DAC donors that is untieda 1990
2003 2004 2005 2006 2007
Percentage . . . . . . . . . . . . . . . . . . . . 67.6 91.8 91.3 92.3 89.0 84.6 Billions of United States dollars 16.3 30.1 30.8 48.9 62.2 60.2 a
Based on only about 40 per cent of total oda commitments from oecd/dac countries, as it excludes technical cooperation and administrative costs, as well as all oda from Austria, Luxembourg, New Zealand and the United States of America, which do not report the tying status of their oda.
Indicator 8.4 ODA received in landlocked developing countries as a proportion of their gross national incomes 1990 2003 2004 2005 2006 2007
Percentage . . . . . . . . . . . . . . . . . . . . . Billions of United States dollars
6.3 8.1 7.8 7.1 6.3 5.6 7.0 12.0 13.9 14.7 16.5 18.7
Indicator 8.5
Target 8.D
ODA received in small island developing States as a proportion of their gross national incomes
Deal comprehensively with the debt problems of developing countries through national and international measures in order to make debt sustainable in the long term
1990 2003 2004 2005 2006 2007
Percentage . . . . . . . . . . . . . . . . . . . . . Billions of United States dollars
2.7 2.1
2.7 1.8
2.8 2.1
2.7 2.5
2.7 2.6
3.0 3.2
Official development assistance (ODA) Market access
Indicator 8.1 Net ODA, total and to the least developed countries, as a percentage of Organization for Economic Cooperation and Development/Development Assistance Committee donors’ gross national income
(a) Annual total assistancea
Indicator 8.6 Proportion of total developed country imports (by value and excluding arms) from developing countries and least developed countries, admitted free of duty (Percentage)
(Billions of United States dollars) 1990 2002 2003 2004
1996 1998 2000 2003 2007a 2005
2006
2007 2008b
All developing countries . . . . 52.7 58.3 69.1 79.4 107.1 104.4 103.5 119.8 Least developed — countries . . . . 15.1 15.8 22.4 23.4 24.6 30.0 32.0 a
Including non-oda debt forgiveness but excluding forgiveness of debt for military purposes. b Preliminary data. (b) Share of OECD/DAC donors’ gross national income (Percentage) 1990 2002 2003 2004 2005 2006
2007 2008a
All developing countries . . . . . . . 0.33 0.23 0.25 0.26 0.33 0.31 0.28 0.30 Least developed — countries . . . . . . . 0.09 0.06 0.08 0.08 0.08 0.09 0.09 a
Preliminary data.
(a) Excluding arms . . . . . . . . . . . . . . . . . . . Developing countriesa . . . . . . . . . . Least developed countries . . . . . . (b) Excluding arms and oil Developing countriesa . . . . . . . . . . Northern Africa . . . . . . . . . . . . . . Sub-Saharan Africa . . . . . . . . . . . Latin America and the Caribbean . . . . . . . . . . . . . Latin America . . . . . . . . . . . . . Eastern Asia . . . . . . . . . . . . . . . . . . Southern Asia . . . . . . . . . . . . . . . . South-Eastern Asia . . . . . . . . . . . Western Asia . . . . . . . . . . . . . . . . . Oceania . . . . . . . . . . . . . . . . . . . . . . Commonwealth of Independent States . . . . . . . . . . Least developed countries . . . . . .
53 68
54 81
63 75
71 81
83 89
54 20 88 58
54 18 89 58
65 26 83 58
71 63 90 92
79 95 93 95
74 35 41 60 45 82 59
77 35 42 58 46 84 59
82 52 46 76 56 79 59
90 60 54 75 57 81 84
93 68 64 79 94 89 89
78
78
70
78
80
Includes Commonwealth of Independent States countries.
a