Report of the Secretary-General
31 Excluding undated protected areas
Least developed countries . . . . . . . . . Landlocked developing countries c Small island developing States . . . . .
1990
2000
2008
Including undated protected areas (total)
0.4 0.0 0.9
1.0 0.0 1.7
9.0 0.0 1.9
9.0 0.0 2.3
a
1990
Commonwealth of Independent States, Asia Commonwealth of Independent States, Europe . . . . . . . . . . . . . . . Developed regions . . . . . . . .
2006
Total
Urban
Rural
Total
Urban
Rural
87
95
80
88
98
79
95 98
98 100
87 95
97 99
99 100
91 97
Ratio of marine protected area to total territorial waters. Includes territories that are not considered in the calculations of regional aggregates. c Some landlocked developing countries have territorial water claims within inland seas.
a No new global or regional data available. Data presented are from 2008 report (A/63/1).
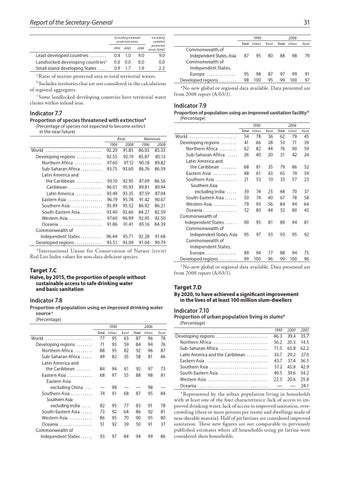
Indicator 7.7
Proportion of population using an improved sanitation facility a
b
Proportion of species threatened with extinction
(Percentage)
a
1990
(Percentage of species not expected to become extinct in the near future) Birds 1994 2008
World . . . . . . . . . . . . . . . . . . . . . . . . . . . . . . Developing regions . . . . . . . . . . . . . . Northern Africa . . . . . . . . . . . . . . . Sub-Saharan Africa . . . . . . . . . . . Latin America and the Caribbean . . . . . . . . . . . . . Caribbean . . . . . . . . . . . . . . . . . . Latin America . . . . . . . . . . . . . . Eastern Asia . . . . . . . . . . . . . . . . . . Southern Asia . . . . . . . . . . . . . . . . South-Eastern Asia . . . . . . . . . . . Western Asia . . . . . . . . . . . . . . . . . Oceania . . . . . . . . . . . . . . . . . . . . . . Commonwealth of Independent States . . . . . . . . . . . Developed regions . . . . . . . . . . . . . .
Indicator 7.9
Mammals 1996 2008
92.20 92.55 97.60 93.75
91.85 92.19 97.12 93.60
86.03 85.87 90.18 86.76
85.33 85.13 89.82 86.59
93.10 96.01 93.49 96.19 95.99 93.40 97.60 91.86
92.95 95.93 93.35 95.78 95.52 92.66 96.99 91.41
87.09 89.81 87.59 91.42 86.92 84.27 92.95 85.16
86.56 89.94 87.04 90.67 86.21 82.59 92.50 84.39
96.44 93.51
95.71 93.09
92.28 91.04
91.68 90.79
a International Union for Conservation of Nature (iucn) Red List Index values for non-data deficient species.
World . . . . . . . . . . . . . . . . . . . . . . . . . Developing regions . . . . . . . . . Northern Africa . . . . . . . . . Sub-Saharan Africa . . . . . Latin America and the Caribbean . . . . . . . . . Eastern Asia . . . . . . . . . . . . . Southern Asia . . . . . . . . . . . Southern Asia excluding India . . . . . . South-Eastern Asia . . . . . . Western Asia . . . . . . . . . . . . Oceania . . . . . . . . . . . . . . . . . Commonwealth of Independent States . . . . . . Commonwealth of Independent States, Asia Commonwealth of Independent States, Europe . . . . . . . . . . . . . . . . Developed regions . . . . . . . . .
2006
Total
Urban
Rural
Total
Urban
Rural
54 41 62 26
78 66 82 40
36 28 44 20
62 53 76 31
79 71 90 42
45 39 59 24
68 48 21
81 61 53
35 43 10
79 65 33
86 74 57
52 59 23
39 50 79 52
74 74 93 80
25 40 56 44
48 67 84 52
70 78 94 80
37 58 64 43
90
95
81
89
94
81
95
97
93
93
95
92
89 99
94 100
77 96
88 99
94 100
75 96
a No new global or regional data available. Data presented are from 2008 report (A/63/1).
Target 7.C
Halve, by 2015, the proportion of people without sustainable access to safe drinking water and basic sanitation
Target 7.D
Indicator 7.8
By 2020, to have achieved a significant improvement in the lives of at least 100 million slum-dwellers
Proportion of population using an improved drinking water source a
Indicator 7.10
(Percentage) 1990
World . . . . . . . . . . . . . . . . . . . . . . . . Developing regions . . . . . . . . Northern Africa . . . . . . . . . Sub-Saharan Africa . . . . . Latin America and the Caribbean . . . . . . . . Eastern Asia . . . . . . . . . . . . Eastern Asia excluding China . . . . Southern Asia . . . . . . . . . . Southern Asia excluding India . . . . . South-Eastern Asia . . . . . Western Asia . . . . . . . . . . . Oceania . . . . . . . . . . . . . . . . Commonwealth of Independent States . . . . .
Proportion of urban population living in slumsa (Percentage)
2006
Total
Urban
Rural
Total
Urban
Rural
77 71 88 49
95 93 95 82
63 59 82 35
87 84 92 58
96 94 96 81
78 76 87 46
84 68
94 97
61 55
92 88
97 98
73 81
— 74
98 91
— 68
— 87
98 95
— 84
82 73 86 51
95 92 95 92
77 64 70 39
83 86 90 50
91 92 95 91
78 81 80 37
93
97
84
94
99
86
Developing regions . . . . . . . . . . . . . . . . . . . . . . . . . . . Northern Africa . . . . . . . . . . . . . . . . . . . . . . . . . . . . . Sub-Saharan Africa . . . . . . . . . . . . . . . . . . . . . . . . . Latin America and the Caribbean . . . . . . . . . . . Eastern Asia . . . . . . . . . . . . . . . . . . . . . . . . . . . . . . . . Southern Asia . . . . . . . . . . . . . . . . . . . . . . . . . . . . . . South-Eastern Asia . . . . . . . . . . . . . . . . . . . . . . . . . Western Asia . . . . . . . . . . . . . . . . . . . . . . . . . . . . . . . Oceania . . . . . . . . . . . . . . . . . . . . . . . . . . . . . . . . . . . . a
1990
2000
2005
46.3 36.2 71.5 33.7 43.7 57.2 49.5 22.5
39.4 20.3 65.8 29.2 37.4 45.8 39.6 20.6
—
—
35.7 14.5 62.2 27.0 36.5 42.9 34.2 25.8 24.1
Represented by the urban population living in households
with at least one of the four characteristics: lack of access to improved drinking water, lack of access to improved sanitation, overcrowding (three or more persons per room) and dwellings made of non-durable material. Half of pit latrines are considered improved sanitation. These new figures are not comparable to previously published estimates where all households using pit latrine were considered slum households.