Report of the Secretary-General
29
Indicator 7.2
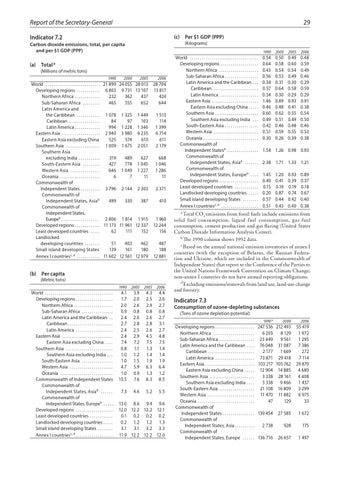
(c) Per $1 GDP (PPP) (Kilograms)
Carbon dioxide emissions, total, per capita and per $1 GDP (PPP) a (a) Total
(Millions of metric tons) 2005
2006
World . . . . . . . . . . . . . . . . . . . . . . . . . . . . 21 899 24 055 28 013 Developing regions . . . . . . . . . . . . 6 803 9 731 13 107 Northern Africa . . . . . . . . . . . . 232 362 437 Sub-Saharan Africa . . . . . . . . . 465 555 652 Latin America and the Caribbean . . . . . . . . . . . . 1 078 1 325 1 449 Caribbean . . . . . . . . . . . . . . . . 84 97 103 Latin America . . . . . . . . . . . . 994 1 228 1 346 Eastern Asia . . . . . . . . . . . . . . . . . . . 2 940 3 980 6 235 Eastern Asia excluding China 525 574 610 Southern Asia . . . . . . . . . . . . . . . . . 1 009 1 675 2 051 Southern Asia excluding India . . . . . . . . . . . 319 489 627 South-Eastern Asia . . . . . . . . . 427 778 1 045 Western Asia . . . . . . . . . . . . . . . 646 1 049 1 227 Oceania . . . . . . . . . . . . . . . . . . . . 6 7 11 Commonwealth of Independent States . . . . . . . . . 3 796 2 144 2 303 Commonwealth of Independent States, Asia b 499 330 387 Commonwealth of Independent States, 2 806 1 814 1 915 Europeb . . . . . . . . . . . . . . . . . . Developed regions . . . . . . . . . . . . 11 173 11 961 12 337 Least developed countries . . . . . 62 111 152 Landlocked developing countries . . . . . . . . 51 403 462 Small island developing States 139 161 180 Annex I countriesc, d . . . . . . . . . . . . 11 602 12 561 12 979
1990
2000
28 704 13 817 424 644 1 513 114 1 399 6 714 611 2 179 668 1 046 1 286 11 2 371 410
1 960 12 244 156 487 188 12 881
(b) Per capita (Metric tons) World . . . . . . . . . . . . . . . . . . . . . . . . . . . . . . . . . . . Developing regions . . . . . . . . . . . . . . . . . . . Northern Africa . . . . . . . . . . . . . . . . . . . . Sub-Saharan Africa . . . . . . . . . . . . . . . . Latin America and the Caribbean . . Caribbean . . . . . . . . . . . . . . . . . . . . . . . Latin America . . . . . . . . . . . . . . . . . . . Eastern Asia . . . . . . . . . . . . . . . . . . . . . . . . . . Eastern Asia excluding China . . . . Southern Asia . . . . . . . . . . . . . . . . . . . . . . . . Southern Asia excluding India . . . South-Eastern Asia . . . . . . . . . . . . . . . . Western Asia . . . . . . . . . . . . . . . . . . . . . . Oceania . . . . . . . . . . . . . . . . . . . . . . . . . . . Commonwealth of Independent States Commonwealth of Independent States, Asia b . . . . . . . Commonwealth of Independent States, Europeb . . . . . Developed regions . . . . . . . . . . . . . . . . . . . Least developed countries . . . . . . . . . . . . Landlocked developing countries . . . . . Small island developing States . . . . . . . . Annex I countriesc, d . . . . . . . . . . . . . . . . . . .
1990
2000
2005
2006
4.1 1.7 2.0 0.9 2.4 2.7 2.4 2.4 7.4 0.8 1.0 1.0 4.7 1.0 13.5
3.9 2.0 2.6 0.8 2.6 2.8 2.5 2.9 7.2 1.1 1.2 1.5 5.9 0.9 7.6
4.3 2.5 2.9 0.8 2.6 2.8 2.6 4.5 7.5 1.3 1.4 1.9 6.3 1.3 8.3
4.4 2.6 2.7 0.8 2.7 3.1 2.7 4.8 7.5 1.4 1.4 1.9 6.4 1.2 8.5
7.3
4.6
5.2
5.5
13.0 8.6 9.4 9.6 12.0 12.2 12.2 12.1 0.1 0.2 0.2 0.2 0.2 1.2 1.2 1.3 3.1 3.1 3.2 3.3 11.9 12.2 12.2 12.0
World . . . . . . . . . . . . . . . . . . . . . . . . . . . . . . . . . . . Developing regions . . . . . . . . . . . . . . . . . . . Northern Africa . . . . . . . . . . . . . . . . . . . . Sub-Saharan Africa . . . . . . . . . . . . . . . . Latin America and the Caribbean . . Caribbean . . . . . . . . . . . . . . . . . . . . . . . Latin America . . . . . . . . . . . . . . . . . . . Eastern Asia . . . . . . . . . . . . . . . . . . . . . . . Eastern Asia excluding China . . . . Southern Asia . . . . . . . . . . . . . . . . . . . . . Southern Asia excluding India . . . South-Eastern Asia . . . . . . . . . . . . . . . . Western Asia . . . . . . . . . . . . . . . . . . . . . . Oceania . . . . . . . . . . . . . . . . . . . . . . . . . . . Commonwealth of Independent Statesb . . . . . . . . . . . . . . . . Commonwealth of Independent States, Asia b . . . . . . . Commonwealth of Independent States, Europe b . . . . Developed regions . . . . . . . . . . . . . . . . . . . Least developed countries . . . . . . . . . . . . Landlocked developing countries . . . . . Small island developing States . . . . . . . . Annex I countriesc, d . . . . . . . . . . . . . . . . . . .
1990
2000
2005
2006
0.54 0.64 0.43 0.56 0.34 0.57 0.34 1.46 0.46 0.60 0.49 0.42 0.51 0.30
0.50 0.58 0.54 0.53 0.31 0.64 0.30 0.89 0.48 0.62 0.51 0.46 0.59 0.26
0.49 0.60 0.54 0.49 0.30 0.58 0.29 0.93 0.41 0.55 0.49 0.48 0.55 0.39
0.48 0.59 0.49 0.46 0.29 0.59 0.29 0.91 0.38 0.54 0.50 0.46 0.53 0.38
1.54 1.26 0.98 0.93 2.38
1.71 1.33 1.21
1.45 0.49 0.15 0.20 0.57 0.51
1.20 0.41 0.19 0.87 0.44 0.43
0.93 0.39 0.19 0.74 0.42 0.40
0.89 0.37 0.18 0.67 0.40 0.38
a Total CO2 emissions from fossil fuels include emissions from solid fuel consumption, liquid fuel consumption, gas fuel consumption, cement production and gas flaring (United States Carbon Dioxide Information Analysis Center). b The 1990 column shows 1992 data. c Based on the annual national emission inventories of annex I countries (with the exception of Belarus, the Russian Federation and Ukraine, which are included in the Commonwealth of Independent States) that report to the Conference of the Parties to the United Nations Framework Convention on Climate Change; non-annex I countries do not have annual reporting obligations. d Excluding emissions/removals from land use, land-use change and forestry.
Indicator 7.3
Consumption of ozone-depleting substances (Tons of ozone depletion potential) 1990 a
Developing regions . . . . . . . . . . . . . . . . . . . . Northern Africa . . . . . . . . . . . . . . . . . . . . . . Sub-Saharan Africa . . . . . . . . . . . . . . . . . . Latin America and the Caribbean . . . . Caribbean . . . . . . . . . . . . . . . . . . . . . . . . Latin America . . . . . . . . . . . . . . . . . . . . . Eastern Asia . . . . . . . . . . . . . . . . . . . . . . . . . Eastern Asia excluding China . . . . . Southern Asia . . . . . . . . . . . . . . . . . . . . . . . Southern Asia excluding India . . . . South-Eastern Asia . . . . . . . . . . . . . . . . . . Western Asia . . . . . . . . . . . . . . . . . . . . . . . . Oceania . . . . . . . . . . . . . . . . . . . . . . . . . . . . . Commonwealth of Independent States . . . . . . . . . . . . . . . Commonwealth of Independent States, Asia . . . . . . . . . . Commonwealth of Independent States, Europe . . . . . . .
2000
2006
247 536 212 493 6 203 8 129 23 449 9 561 76 048 31 087 2 177 1 669 73 871 29 418 103 217 105 762 12 904 14 885 3 338 28 161 3 338 9 466 21 108 16 809 11 470 11 882 47 129
55 419 1 972 1 295 7 386 272 7 114 29 870 4 680 4 408 1 437 3 299 6 975 33
139 454
27 585
1 672
2 738
928
175
136 716
26 657
1 497