Yearbook of the United Nations, 2009
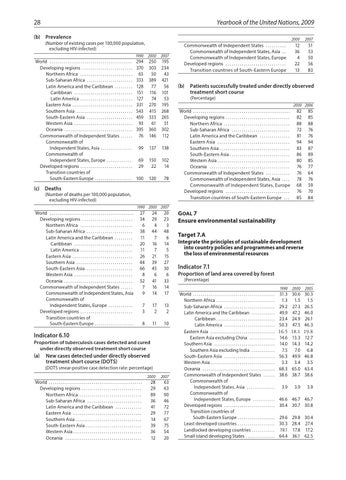
28 (b) Prevalence (Number of existing cases per 100,000 population, excluding HIV-infected) World . . . . . . . . . . . . . . . . . . . . . . . . . . . . . . . . . . . . . . . . . . Developing regions . . . . . . . . . . . . . . . . . . . . . . . . . Northern Africa . . . . . . . . . . . . . . . . . . . . . . . . . . Sub-Saharan Africa . . . . . . . . . . . . . . . . . . . . . . Latin America and the Caribbean . . . . . . . . Caribbean . . . . . . . . . . . . . . . . . . . . . . . . . . . . . Latin America . . . . . . . . . . . . . . . . . . . . . . . . . Eastern Asia . . . . . . . . . . . . . . . . . . . . . . . . . . . . . Southern Asia . . . . . . . . . . . . . . . . . . . . . . . . . . . . South-Eastern Asia . . . . . . . . . . . . . . . . . . . . . . . Western Asia . . . . . . . . . . . . . . . . . . . . . . . . . . . . . Oceania . . . . . . . . . . . . . . . . . . . . . . . . . . . . . . . . . Commonwealth of Independent States . . . . . Commonwealth of Independent States, Asia . . . . . . . . . . . . . . . Commonwealth of Independent States, Europe . . . . . . . . . . . . Developed regions . . . . . . . . . . . . . . . . . . . . . . . . . Transition countries of South-Eastern Europe . . . . . . . . . . . . . . . . . .
1990
2000
2007
294 370 65 333 128 151 127 331 543 459 93 395 76
250 303 50 389 77 116 74 270 415 333 61 360 146
195 234 43 421 56 101 53 195 268 265 51 302 112
99
137
138
69 29
150 22
102 14
100
120
78
1990 2000
2007
(c) Deaths (Number of deaths per 100,000 population, excluding HIV-infected) World . . . . . . . . . . . . . . . . . . . . . . . . . . . . . . . . . . . . . . . . . . . Developing regions . . . . . . . . . . . . . . . . . . . . . . . . . . Northern Africa . . . . . . . . . . . . . . . . . . . . . . . . . . . Sub-Saharan Africa . . . . . . . . . . . . . . . . . . . . . . . Latin America and the Caribbean . . . . . . . . . Caribbean . . . . . . . . . . . . . . . . . . . . . . . . . . . . . . Latin America . . . . . . . . . . . . . . . . . . . . . . . . . . Eastern Asia . . . . . . . . . . . . . . . . . . . . . . . . . . . . . . Southern Asia . . . . . . . . . . . . . . . . . . . . . . . . . . . . . South-Eastern Asia . . . . . . . . . . . . . . . . . . . . . . . Western Asia . . . . . . . . . . . . . . . . . . . . . . . . . . . . . . Oceania . . . . . . . . . . . . . . . . . . . . . . . . . . . . . . . . . . Commonwealth of Independent States . . . . . . Commonwealth of Independent States, Asia Commonwealth of Independent States, Europe . . . . . . . . . . . . Developed regions . . . . . . . . . . . . . . . . . . . . . . . . . . Transition countries of South-Eastern Europe . . . . . . . . . . . . . . . . . . .
27 34 6 38 11 20 11 26 44 66 8 52 7 9
24 29 4 44 7 16 7 21 39 45 6 41 16 14
20 23 3 48 6 14 5 15 27 30 6 33 14 17
7 3
17 2
13 2
8
11
10
Indicator 6.10 Proportion of tuberculosis cases detected and cured under directly observed treatment short course
(a) New cases detected under directly observed treatment short course (DOTS) (DOTS smear-positive case detection rate: percentage) World . . . . . . . . . . . . . . . . . . . . . . . . . . . . . . . . . . . . . . . . . . . . . . . . Developing regions . . . . . . . . . . . . . . . . . . . . . . . . . . . . . . . Northern Africa . . . . . . . . . . . . . . . . . . . . . . . . . . . . . . . . Sub-Saharan Africa . . . . . . . . . . . . . . . . . . . . . . . . . . . . Latin America and the Caribbean . . . . . . . . . . . . . . Eastern Asia . . . . . . . . . . . . . . . . . . . . . . . . . . . . . . . . . . . Southern Asia . . . . . . . . . . . . . . . . . . . . . . . . . . . . . . . . . . South-Eastern Asia . . . . . . . . . . . . . . . . . . . . . . . . . . . . Western Asia . . . . . . . . . . . . . . . . . . . . . . . . . . . . . . . . . . . Oceania . . . . . . . . . . . . . . . . . . . . . . . . . . . . . . . . . . . . . . .
2000
2007
28 29 89 36 41 29 14 39 36 12
63 63 90 46 72 77 67 75 54 20
Commonwealth of Independent States . . . . . . . . . . . Commonwealth of Independent States, Asia . . . Commonwealth of Independent States, Europe Developed regions . . . . . . . . . . . . . . . . . . . . . . . . . . . . . . . Transition countries of South-Eastern Europe
2000
2007
12 36 4 22 13
51 53 50 56 83
(b) Patients successfully treated under directly observed treatment short course (Percentage) 2000 2006
World . . . . . . . . . . . . . . . . . . . . . . . . . . . . . . . . . . . . . . . . . . . . . . . . . . Developing regions . . . . . . . . . . . . . . . . . . . . . . . . . . . . . . . . Northern Africa . . . . . . . . . . . . . . . . . . . . . . . . . . . . . . . . . Sub-Saharan Africa . . . . . . . . . . . . . . . . . . . . . . . . . . . . . Latin America and the Caribbean . . . . . . . . . . . . . . . Eastern Asia . . . . . . . . . . . . . . . . . . . . . . . . . . . . . . . . . . . . Southern Asia . . . . . . . . . . . . . . . . . . . . . . . . . . . . . . . . . . . South-Eastern Asia . . . . . . . . . . . . . . . . . . . . . . . . . . . . . . Western Asia . . . . . . . . . . . . . . . . . . . . . . . . . . . . . . . . . . . . Oceania . . . . . . . . . . . . . . . . . . . . . . . . . . . . . . . . . . . . . . . . Commonwealth of Independent States . . . . . . . . . . . . Commonwealth of Independent States, Asia . . . . Commonwealth of Independent States, Europe Developed regions . . . . . . . . . . . . . . . . . . . . . . . . . . . . . . . . Transition countries of South-Eastern Europe . . .
82 82 88 72 81 94 83 86 80 76 76 78 68 76 85
85 85 88 76 76 94 87 89 85 77 64 76 59 70 84
Goal 7 Ensure environmental sustainability Target 7.A
Integrate the principles of sustainable development into country policies and programmes and reverse the loss of environmental resources
Indicator 7.1
Proportion of land area covered by forest (Percentage) 1990
World . . . . . . . . . . . . . . . . . . . . . . . . . . . . . . . . . . . . . . . . . . Northern Africa . . . . . . . . . . . . . . . . . . . . . . . . . . . . . . Sub-Saharan Africa . . . . . . . . . . . . . . . . . . . . . . . . . . Latin America and the Caribbean . . . . . . . . . . . . Caribbean . . . . . . . . . . . . . . . . . . . . . . . . . . . . . . Latin America . . . . . . . . . . . . . . . . . . . . . . . . . . Eastern Asia . . . . . . . . . . . . . . . . . . . . . . . . . . . . . . . . . Eastern Asia excluding China . . . . . . . . . . . . . Southern Asia . . . . . . . . . . . . . . . . . . . . . . . . . . . . . . . Southern Asia excluding India . . . . . . . . . . . . South-Eastern Asia . . . . . . . . . . . . . . . . . . . . . . . . . . Western Asia . . . . . . . . . . . . . . . . . . . . . . . . . . . . . . . . . Oceania . . . . . . . . . . . . . . . . . . . . . . . . . . . . . . . . . . . . . Commonwealth of Independent States . . . . . . Commonwealth of Independent States, Asia . . . . . . . . . . . . . . Commonwealth of Independent States, Europe . . . . . . . . . . . Developed regions . . . . . . . . . . . . . . . . . . . . . . . . . . Transition countries of South-Eastern Europe . . . . . . . . . . . . . . . . . . . Least developed countries . . . . . . . . . . . . . . . . . . . Landlocked developing countries . . . . . . . . . . . . Small island developing States . . . . . . . . . . . . . . .
2000
2005
31.3 30.6 30.3 1.3 1.5 1.5 29.2 27.3 26.5 49.9 47.2 46.0 23.4 24.9 26.1 50.3 47.5 46.3
16.5 18.1 19.8 14.6 14.0 7.5 56.3 3.3 68.3 38.6
13.3 14.3 7.0 49.9 3.4 65.0 38.7
12.7 14.2 6.8 46.8 3.5 63.4 38.6
3.9
3.9
3.9
46.6 46.7 46.7 30.4 30.7 30.8 29.6 29.8 30.4 30.3 28.4 27.4 19.1 17.8 17.2 64.4 36.1 62.5