Yearbook of the United Nations, 2009
26 Indicator 5.6
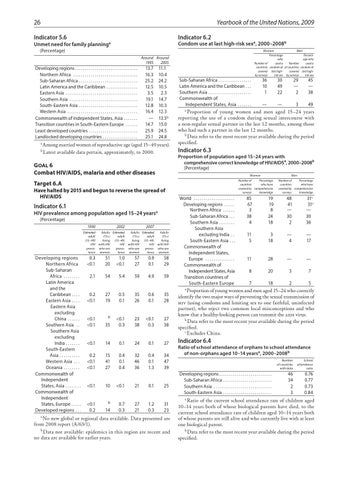
Indicator 6.2
Condom use at last high-risk sexa, 2000–2008b
Unmet need for family planninga (Percentage)
Women
Around Around 1995 2005
Developing regions . . . . . . . . . . . . . . . . . . . . . . . . . . . . . . . . Northern Africa . . . . . . . . . . . . . . . . . . . . . . . . . . . . . . . . . . Sub-Saharan Africa . . . . . . . . . . . . . . . . . . . . . . . . . . . . . . Latin America and the Caribbean . . . . . . . . . . . . . . . . Eastern Asia . . . . . . . . . . . . . . . . . . . . . . . . . . . . . . . . . . . . . Southern Asia . . . . . . . . . . . . . . . . . . . . . . . . . . . . . . . . . . . South-Eastern Asia . . . . . . . . . . . . . . . . . . . . . . . . . . . . . . Western Asia . . . . . . . . . . . . . . . . . . . . . . . . . . . . . . . . . . . . Commonwealth of Independent States, Asia . . . . . . . Transition countries in South-Eastern Europe . . . . . . . Least developed countries . . . . . . . . . . . . . . . . . . . . . . . . . Landlocked developing countries . . . . . . . . . . . . . . . . . .
13.7 16.3 25.2 12.5 3.5 19.1 12.8 16.4 — 14.7 25.9 25.1
11.1 10.4 24.2 10.5 2.3 14.7 10.3 12.3 13.5b 15.0 24.5 24.8
Number of countries covered by surveys
Sub-Saharan Africa . . . . . . . . . . . . . . . . . . Latin America and the Caribbean . . . . Southern Asia . . . . . . . . . . . . . . . . . . . . . . . Commonwealth of Independent States, Asia . . . . . . . .
Men
PercentPercentage age who who used a Number used a condom at of countries condom at covered last highlast highrisk sex risk sex by surveys
36 10 1
30 49 22
29 — 2
45 — 38
—
—
3
49
a
a
Proportion of young women and men aged 15–24 years reporting the use of a condom during sexual intercourse with a non-regular sexual partner in the last 12 months, among those who had such a partner in the last 12 months. b Data refer to the most recent year available during the period specified.
b
Indicator 6.3
Among married women of reproductive age (aged 15–49 years). Latest available data pertain, approximately, to 2000.
Goal 6 Combat HIV/AIDS, malaria and other diseases
Proportion of population aged 15–24 years with comprehensive correct knowledge of HIV/AIDSa, 2000–2008b (Percentage)
Women
Target 6.A
Have halted by 2015 and begun to reverse the spread of HIV/AIDS
Indicator 6.1
HIV prevalence among population aged 15–24 yearsa (Percentage) 1990
2002
2007
Estimated Adults Estimated Adults Estimated Adults adult (15+) adult (15+) adult (15+) (15–49) living (15–49) living (15–49) living HIV with HIV HIV with HIV HIV with HIV preva- who are preva- who are preva- who are lence women lence women lence women
Developing regions Northern Africa Sub-Saharan Africa . . . . . . . . . Latin America and the Caribbean . . . . . Eastern Asia . . . . . Eastern Asia excluding China . . . . . . . Southern Asia . . . Southern Asia excluding India . . . . . . . . South-Eastern Asia . . . . . . . . . . . Western Asia . . . . Oceania . . . . . . . . . Commonwealth of Independent States, Asia. . . . . . . . Commonwealth of Independent States, Europe. . . . . Developed regions . . . a
0.3 <0.1
51 20
1.0 <0.1
57 27
0.9 0.1
58 29
2.1
54
5.4
59
4.9
59
Men
Percentage Number of who have countries covered by comprehensive knowledge surveys
World . . . . . . . . . . . . . . . . . . . . . Developing regions . . . . . . Northern Africa . . . . . . Sub-Saharan Africa . . Southern Asia . . . . . . . Southern Asia excluding India . . South-Eastern Asia . . Commonwealth of Independent States, Europe . . . . . . . . . . . . . . . Commonwealth of Independent States, Asia Transition countries of South-Eastern Europe
Percentage Number of who have countries covered by comprehensive knowledge surveys
85 67 3 38 4
19 19 8 24 18
48 41 — 30 2
31c 31c — 30 36
11 5
3 18
— 4
— 17
11
28
—
—
8
20
3
7
7
18
2
5
a
0.2 <0.1
27 19
0.5 0.1
35 26
0.6 0.1
35 28
<0.1 <0.1
b
35
<0.1 0.3
23 38
<0.1 0.3
27 38
<0.1
14
0.1
24
0.1
27
0.2 <0.1 <0.1
15 41 27
0.4 0.1 0.4
32 46 36
0.4 0.1 1.3
34 47 39
<0.1
10
<0.1
21
0.1
25
<0.1 0.2
b
0.7 0.3
27 21
1.2 0.3
31 23
14
No new global or regional data available. Data presented are from 2008 report (A/63/1). b Data not available: epidemics in this region are recent and no data are available for earlier years.
Proportion of young women and men aged 15–24 who correctly identify the two major ways of preventing the sexual transmission of hiv (using condoms and limiting sex to one faithful, uninfected partner), who reject two common local misconceptions and who know that a healthy-looking person can transmit the aids virus. b Data refer to the most recent year available during the period specified. c Excludes China.
Indicator 6.4
Ratio of school attendance of orphans to school attendance of non-orphans aged 10–14 yearsa, 2000–2008b
Developing regions . . . . . . . . . . . . . . . . . . . . . . . . . . . Sub-Saharan Africa . . . . . . . . . . . . . . . . . . . . . . . . . Southern Asia . . . . . . . . . . . . . . . . . . . . . . . . . . . . . . South-Eastern Asia . . . . . . . . . . . . . . . . . . . . . . . . .
Number of countries with data
School attendance ratio
46 34 2 3
0.76 0.77 0.73 0.84
a Ratio of the current school attendance rate of children aged 10–14 years both of whose biological parents have died, to the current school attendance rate of children aged 10–14 years both of whose parents are still alive and who currently live with at least one biological parent. b Data refer to the most recent year available during the period specified.