Report of the Secretary-General
25 1990 2005
Least developed countries . . . . . . . . . . . . . . . . . . . . . . . . . . .
900
870
a
Maternal deaths per 100,000 live births. No new global or regional data are available. Data presented are from 2008 report (A/63/1). b
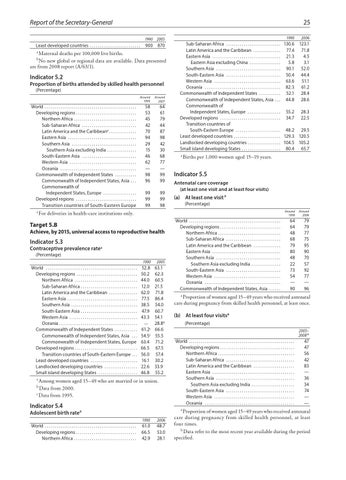
Indicator 5.2
Proportion of births attended by skilled health personnel (Percentage) World . . . . . . . . . . . . . . . . . . . . . . . . . . . . . . . . . . . . . . . . . . . . . . . Developing regions . . . . . . . . . . . . . . . . . . . . . . . . . . . . . . . Northern Africa . . . . . . . . . . . . . . . . . . . . . . . . . . . . . . . . Sub-Saharan Africa . . . . . . . . . . . . . . . . . . . . . . . . . . . . Latin America and the Caribbeana . . . . . . . . . . . . . . Eastern Asia . . . . . . . . . . . . . . . . . . . . . . . . . . . . . . . . . . . Southern Asia . . . . . . . . . . . . . . . . . . . . . . . . . . . . . . . . . Southern Asia excluding India . . . . . . . . . . . . . . . South-Eastern Asia . . . . . . . . . . . . . . . . . . . . . . . . . . . . Western Asia . . . . . . . . . . . . . . . . . . . . . . . . . . . . . . . . . . Oceania . . . . . . . . . . . . . . . . . . . . . . . . . . . . . . . . . . . . . . . Commonwealth of Independent States . . . . . . . . . . . Commonwealth of Independent States, Asia . . . Commonwealth of Independent States, Europe . . . . . . . . . . . . . . . . . Developed regions . . . . . . . . . . . . . . . . . . . . . . . . . . . . . . . Transition countries of South-Eastern Europe
Around 1990
Around 2007
58 53 45 42 70 94 29 15 46 62 — 98 96
64 61 79 44 87 98 42 30 68 77 — 99 99
99 99 99
99 99 98
1990
a
Births per 1,000 women aged 15–19 years.
Indicator 5.5 Antenatal care coverage (at least one visit and at least four visits)
(a) At least one visit a (Percentage)
a
For deliveries in health-care institutions only.
Target 5.B
Achieve, by 2015, universal access to reproductive health
Indicator 5.3
Contraceptive prevalence ratea (Percentage) 1990
World . . . . . . . . . . . . . . . . . . . . . . . . . . . . . . . . . . . . . . . . . . . . . . . Developing regions . . . . . . . . . . . . . . . . . . . . . . . . . . . . . . . Northern Africa . . . . . . . . . . . . . . . . . . . . . . . . . . . . . . . . Sub-Saharan Africa . . . . . . . . . . . . . . . . . . . . . . . . . . . . Latin America and the Caribbean . . . . . . . . . . . . . . Eastern Asia . . . . . . . . . . . . . . . . . . . . . . . . . . . . . . . . . . . Southern Asia . . . . . . . . . . . . . . . . . . . . . . . . . . . . . . . . . South-Eastern Asia . . . . . . . . . . . . . . . . . . . . . . . . . . . . Western Asia . . . . . . . . . . . . . . . . . . . . . . . . . . . . . . . . . . Oceania . . . . . . . . . . . . . . . . . . . . . . . . . . . . . . . . . . . . . . . Commonwealth of Independent States . . . . . . . . . . . Commonwealth of Independent States, Asia . . . Commonwealth of Independent States, Europe Developed regions . . . . . . . . . . . . . . . . . . . . . . . . . . . . . . . Transition countries of South-Eastern Europe . . Least developed countries . . . . . . . . . . . . . . . . . . . . . . . . Landlocked developing countries . . . . . . . . . . . . . . . . . Small island developing States . . . . . . . . . . . . . . . . . . . .
2005
52.8 63.1 50.2 62.3 44.0 60.5 12.0 21.5 62.0 71.8 77.5 86.4 38.5 54.0 47.9 60.7 43.3 54.1 — 28.8b 61.2c 66.6 54.5c 55.5 63.4 71.2 66.5 67.5 56.0 57.4 16.1 30.2 22.6 33.9 46.8 55.2
a
Among women aged 15–49 who are married or in union. Data from 2000. c Data from 1995. b
Indicator 5.4
Adolescent birth ratea World . . . . . . . . . . . . . . . . . . . . . . . . . . . . . . . . . . . . . . . . . . . . . . . Developing regions . . . . . . . . . . . . . . . . . . . . . . . . . . . . . . . Northern Africa . . . . . . . . . . . . . . . . . . . . . . . . . . . . . . . .
1990
2006
61.0 66.5 42.9
48.7 53.0 28.1
2006
Sub-Saharan Africa . . . . . . . . . . . . . . . . . . . . . . . . . . . . 130.6 123.1 Latin America and the Caribbean . . . . . . . . . . . . . . 77.4 71.8 Eastern Asia . . . . . . . . . . . . . . . . . . . . . . . . . . . . . . . . . . . 21.3 4.5 Eastern Asia excluding China . . . . . . . . . . . . . . . . 5.8 3.1 Southern Asia . . . . . . . . . . . . . . . . . . . . . . . . . . . . . . . . . 90.1 52.0 South-Eastern Asia . . . . . . . . . . . . . . . . . . . . . . . . . . . . 50.4 44.4 Western Asia . . . . . . . . . . . . . . . . . . . . . . . . . . . . . . . . . . 63.6 51.1 Oceania . . . . . . . . . . . . . . . . . . . . . . . . . . . . . . . . . . . . . . . 82.3 61.2 Commonwealth of Independent States . . . . . . . . . . . 52.1 28.4 Commonwealth of Independent States, Asia . . . 44.8 28.6 Commonwealth of Independent States, Europe . . . . . . . . . . . . . . . . . 55.2 28.3 Developed regions . . . . . . . . . . . . . . . . . . . . . . . . . . . . . . . 34.7 22.5 Transition countries of South-Eastern Europe . . . . . . . . . . . . . . . . . . . . . . . 48.2 29.5 Least developed countries . . . . . . . . . . . . . . . . . . . . . . . . 129.3 120.5 Landlocked developing countries . . . . . . . . . . . . . . . . . 104.5 105.2 Small island developing States . . . . . . . . . . . . . . . . . . . . 80.4 65.7
World . . . . . . . . . . . . . . . . . . . . . . . . . . . . . . . . . . . . . . . . . . . . . . . Developing regions . . . . . . . . . . . . . . . . . . . . . . . . . . . . . . . Northern Africa . . . . . . . . . . . . . . . . . . . . . . . . . . . . . . . . Sub-Saharan Africa . . . . . . . . . . . . . . . . . . . . . . . . . . . . Latin America and the Caribbean . . . . . . . . . . . . . . Eastern Asia . . . . . . . . . . . . . . . . . . . . . . . . . . . . . . . . . . . Southern Asia . . . . . . . . . . . . . . . . . . . . . . . . . . . . . . . . . Southern Asia excluding India . . . . . . . . . . . . . . . South-Eastern Asia . . . . . . . . . . . . . . . . . . . . . . . . . . . . Western Asia . . . . . . . . . . . . . . . . . . . . . . . . . . . . . . . . . . Oceania . . . . . . . . . . . . . . . . . . . . . . . . . . . . . . . . . . . . . . . Commonwealth of Independent States, Asia . . . . . .
Around 1990
Around 2006
64 64 48 68 79 80 48 22 73 54 — 90
79 79 77 75 95 90 70 57 92 77 — 96
a Proportion of women aged 15–49 years who received antenatal care during pregnancy from skilled health personnel, at least once.
(b) At least four visitsa (Percentage) 2003– 2008 b
World . . . . . . . . . . . . . . . . . . . . . . . . . . . . . . . . . . . . . . . . . . . . . . . . . . . . . . Developing regions . . . . . . . . . . . . . . . . . . . . . . . . . . . . . . . . . . . . . . Northern Africa . . . . . . . . . . . . . . . . . . . . . . . . . . . . . . . . . . . . . . . Sub-Saharan Africa . . . . . . . . . . . . . . . . . . . . . . . . . . . . . . . . . . . Latin America and the Caribbean . . . . . . . . . . . . . . . . . . . . . Eastern Asia . . . . . . . . . . . . . . . . . . . . . . . . . . . . . . . . . . . . . . . . . . Southern Asia . . . . . . . . . . . . . . . . . . . . . . . . . . . . . . . . . . . . . . . . Southern Asia excluding India . . . . . . . . . . . . . . . . . . . . . . South-Eastern Asia . . . . . . . . . . . . . . . . . . . . . . . . . . . . . . . . . . . Western Asia . . . . . . . . . . . . . . . . . . . . . . . . . . . . . . . . . . . . . . . . . Oceania . . . . . . . . . . . . . . . . . . . . . . . . . . . . . . . . . . . . . . . . . . . . . .
47 47 56 42 83 — 36 34 74 — —
a Proportion of women aged 15–49 years who received antenatal care during pregnancy from skilled health personnel, at least four times. b Data refer to the most recent year available during the period specified.