Yearbook of the United Nations, 2009
24 Latin America . . . . . . . . . . . . . . . . . . . Eastern Asia . . . . . . . . . . . . . . . . . . . . . . . Eastern Asia excluding China . . . . Southern Asia . . . . . . . . . . . . . . . . . . . . . Southern Asia excluding India . . . South-Eastern Asia . . . . . . . . . . . . . . . . . . . Western Asia . . . . . . . . . . . . . . . . . . . . . . . . . Oceania . . . . . . . . . . . . . . . . . . . . . . . . . . . . . . Commonwealth of Independent States . . . . . . . . . . . . . . . . Commonwealth of Independent States, Asia . . . . . . . Commonwealth of Independent States, Europe . . . . Developed regions . . . . . . . . . . . . . . . . . . . . Least developed countries . . . . . . . . . . . . Landlocked developing countries . . . . . Small island developing States . . . . . . . .
1990
2000
2005 2009 b
8.6 20.2 17.8 5.7 5.9 10.4 4.6 1.2
12.9 19.9 14.6 6.7 5.6 9.7 4.7 3.4
16.4 19.4 17.2 8.6 8.8 15.5 5.0 3.0
19.4 20.2 17.2 16.7 18.7 17.3 9.2 2.5
—
7.3
10.2
14.1
—
7.1
9.9
14.0
— 16.3 7.2 14.0 15.2
7.5 17.5 7.3 7.7 13.1
10.5 20.9 12.9 13.4 17.8
14.1 22.9 18.8 21.0 20.9
a
Single or lower house only. b As of 31 January 2009.
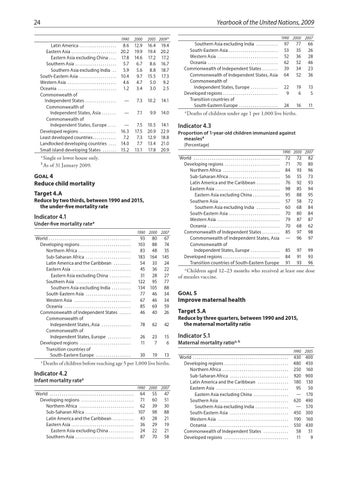
Goal 4 Reduce child mortality Target 4.A
Reduce by two thirds, between 1990 and 2015, the under-five mortality rate
Indicator 4.1
Under-five mortality ratea World . . . . . . . . . . . . . . . . . . . . . . . . . . . . . . . . . . . . . . . . . . . Developing regions . . . . . . . . . . . . . . . . . . . . . . . . . . . Northern Africa . . . . . . . . . . . . . . . . . . . . . . . . . . . . Sub-Saharan Africa . . . . . . . . . . . . . . . . . . . . . . . . Latin America and the Caribbean . . . . . . . . . . Eastern Asia . . . . . . . . . . . . . . . . . . . . . . . . . . . . . . . Eastern Asia excluding China . . . . . . . . . . . . Southern Asia . . . . . . . . . . . . . . . . . . . . . . . . . . . . . Southern Asia excluding India . . . . . . . . . . . South-Eastern Asia . . . . . . . . . . . . . . . . . . . . . . . . Western Asia . . . . . . . . . . . . . . . . . . . . . . . . . . . . . . Oceania . . . . . . . . . . . . . . . . . . . . . . . . . . . . . . . . . . . Commonwealth of Independent States . . . . . . . Commonwealth of Independent States, Asia . . . . . . . . . . . . . . . . Commonwealth of Independent States, Europe . . . . . . . . . . . . . Developed regions . . . . . . . . . . . . . . . . . . . . . . . . . . . Transition countries of South-Eastern Europe . . . . . . . . . . . . . . . . . . .
1990 2000
Southern Asia excluding India . . . . . . . . . . . South-Eastern Asia . . . . . . . . . . . . . . . . . . . . . . . . Western Asia . . . . . . . . . . . . . . . . . . . . . . . . . . . . . . Oceania . . . . . . . . . . . . . . . . . . . . . . . . . . . . . . . . . . . Commonwealth of Independent States . . . . . . . Commonwealth of Independent States, Asia Commonwealth of Independent States, Europe . . . . . . . . . . . . . Developed regions . . . . . . . . . . . . . . . . . . . . . . . . . . . Transition countries of South-Eastern Europe . . . . . . . . . . . . . . . . . . .
77 35 36 52 34 52
66 26 28 46 23 36
22 9
19 6
13 5
24
16
11
a
Deaths of children under age 1 per 1,000 live births.
Indicator 4.3 Proportion of 1-year-old children immunized against measlesa (Percentage) 1990 2000 2007
World . . . . . . . . . . . . . . . . . . . . . . . . . . . . . . . . . . . . . . . . . . . . Developing regions . . . . . . . . . . . . . . . . . . . . . . . . . . . . Northern Africa . . . . . . . . . . . . . . . . . . . . . . . . . . . . . Sub-Saharan Africa . . . . . . . . . . . . . . . . . . . . . . . . . Latin America and the Caribbean . . . . . . . . . . . Eastern Asia . . . . . . . . . . . . . . . . . . . . . . . . . . . . . . . . Eastern Asia excluding China . . . . . . . . . . . . . Southern Asia . . . . . . . . . . . . . . . . . . . . . . . . . . . . . . Southern Asia excluding India . . . . . . . . . . . . South-Eastern Asia . . . . . . . . . . . . . . . . . . . . . . . . . Western Asia . . . . . . . . . . . . . . . . . . . . . . . . . . . . . . . Oceania . . . . . . . . . . . . . . . . . . . . . . . . . . . . . . . . . . . . Commonwealth of Independent States . . . . . . . . Commonwealth of Independent States, Asia Commonwealth of Independent States, Europe . . . . . . . . . . . . . . Developed regions . . . . . . . . . . . . . . . . . . . . . . . . . . . . Transition countries of South-Eastern Europe
72 71 84 56 76 98 95 57 60 70 79 70 85 —
72 70 93 55 92 85 88 58 68 80 87 68 97 96
82 80 96 73 93 94 95 72 84 84 87 62 98 97
85 84 91
97 91 93
99 93 96
1990 2000
2007
93 103 83 183 54 45 31 122 134 77 67 85 46
80 88 48 164 33 36 28 95 105 46 46 69 40
67 74 35 145 24 22 27 77 88 34 34 59 26
78
62
42
26 11
23 7
15 6
Indicator 5.1
30
19
13
World . . . . . . . . . . . . . . . . . . . . . . . . . . . . . . . . . . . . . . . . . . . . . . . . . . Developing regions . . . . . . . . . . . . . . . . . . . . . . . . . . . . . . . . . . Northern Africa . . . . . . . . . . . . . . . . . . . . . . . . . . . . . . . . . . . Sub-Saharan Africa . . . . . . . . . . . . . . . . . . . . . . . . . . . . . . . Latin America and the Caribbean . . . . . . . . . . . . . . . . . Eastern Asia . . . . . . . . . . . . . . . . . . . . . . . . . . . . . . . . . . . . . . Eastern Asia excluding China . . . . . . . . . . . . . . . . . . . Southern Asia . . . . . . . . . . . . . . . . . . . . . . . . . . . . . . . . . . . . Southern Asia excluding India . . . . . . . . . . . . . . . . . . South-Eastern Asia . . . . . . . . . . . . . . . . . . . . . . . . . . . . . . . Western Asia . . . . . . . . . . . . . . . . . . . . . . . . . . . . . . . . . . . . . Oceania . . . . . . . . . . . . . . . . . . . . . . . . . . . . . . . . . . . . . . . . . . Commonwealth of Independent States . . . . . . . . . . . . . . Developed regions . . . . . . . . . . . . . . . . . . . . . . . . . . . . . . . . . .
Deaths of children before reaching age 5 per 1,000 live births.
a
Indicator 4.2
Infant mortality ratea 1990 2000
World . . . . . . . . . . . . . . . . . . . . . . . . . . . . . . . . . . . . . . . . . . . 64 Developing regions . . . . . . . . . . . . . . . . . . . . . . . . . . . 71 Northern Africa . . . . . . . . . . . . . . . . . . . . . . . . . . . . 62 Sub-Saharan Africa . . . . . . . . . . . . . . . . . . . . . . . . 107 Latin America and the Caribbean . . . . . . . . . . 43 Eastern Asia . . . . . . . . . . . . . . . . . . . . . . . . . . . . . . . 36 Eastern Asia excluding China . . . . . . . . . . . . 24 Southern Asia . . . . . . . . . . . . . . . . . . . . . . . . . . . . . 87
55 60 39 98 28 29 22 70
2007
47 51 30 88 21 19 21 58
2007
97 53 52 62 39 64
a Children aged 12–23 months who received at least one dose of measles vaccine.
Goal 5 Improve maternal health Target 5.A
Reduce by three quarters, between 1990 and 2015, the maternal mortality ratio Maternal mortality ratioa, b 1990 2005
430 400 480 450 250 160 920 900 180 130 95 50 — 170 620 490 — 570 450 300 190 160 550 430 58 51 11 9