Report of the Secretary-General
23
1985–1994
1995–2004
2005–2007
Men Women
Men Women
Men Women
Small island developing States . . . . . . 81.9
78.6 83.5
80.6 84.6
83.4
a
The regional averages presented in this table are calculated using a weighted average of the latest available observed data point for each country or territory for the reference period. Unesco Institute for Statistics estimates have been used for countries with missing data.
Goal 3 Promote gender equality and empower women Target 3.A
Eliminate gender disparity in primary and secondary education, preferably by 2005, and in all levels of education no later than 2015
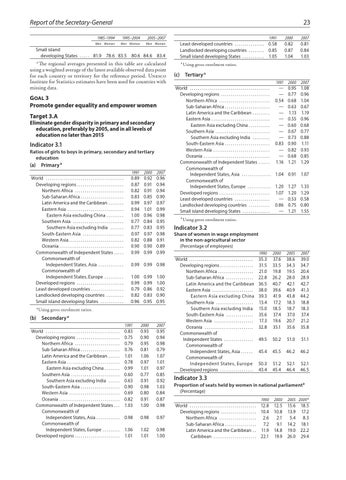
Indicator 3.1 Ratios of girls to boys in primary, secondary and tertiary education a (a) Primary
World . . . . . . . . . . . . . . . . . . . . . . . . . . . . . . . . . . . . . . . . . Developing regions . . . . . . . . . . . . . . . . . . . . . . . . Northern Africa . . . . . . . . . . . . . . . . . . . . . . . . . . Sub-Saharan Africa . . . . . . . . . . . . . . . . . . . . . . Latin America and the Caribbean . . . . . . . . Eastern Asia . . . . . . . . . . . . . . . . . . . . . . . . . . . . . Eastern Asia excluding China . . . . . . . . . Southern Asia . . . . . . . . . . . . . . . . . . . . . . . . . . . Southern Asia excluding India . . . . . . . . South-Eastern Asia . . . . . . . . . . . . . . . . . . . . . . Western Asia . . . . . . . . . . . . . . . . . . . . . . . . . . . . Oceania . . . . . . . . . . . . . . . . . . . . . . . . . . . . . . . . . Commonwealth of Independent States . . . . . Commonwealth of Independent States, Asia . . . . . . . . . . . . . Commonwealth of Independent States, Europe . . . . . . . . . . Developed regions . . . . . . . . . . . . . . . . . . . . . . . . . Least developed countries . . . . . . . . . . . . . . . . . Landlocked developing countries . . . . . . . . . . Small island developing States . . . . . . . . . . . . .
1991
2000
2007
0.89 0.87 0.82 0.83 0.99 0.94 1.00 0.77 0.77 0.97 0.82 0.90 0.99
0.92 0.91 0.91 0.85 0.97 1.01 0.96 0.84 0.83 0.97 0.88 0.90 0.99
0.96 0.94 0.94 0.90 0.97 0.99 0.98 0.95 0.95 0.98 0.91 0.89 0.99
0.99 0.99 0.98 1.00 0.99 0.79 0.82 0.96
0.99 0.99 0.86 0.83 0.95
1.00 1.00 0.92 0.90 0.95
a
Using gross enrolment ratios.
a (b) Secondary
World . . . . . . . . . . . . . . . . . . . . . . . . . . . . . . . . . . . . . . Developing regions . . . . . . . . . . . . . . . . . . . . . . Northern Africa . . . . . . . . . . . . . . . . . . . . . . . Sub-Saharan Africa . . . . . . . . . . . . . . . . . . . Latin America and the Caribbean . . . . . Eastern Asia . . . . . . . . . . . . . . . . . . . . . . . . . . Eastern Asia excluding China . . . . . . . Southern Asia . . . . . . . . . . . . . . . . . . . . . . . . Southern Asia excluding India . . . . . . South-Eastern Asia . . . . . . . . . . . . . . . . . . . Western Asia . . . . . . . . . . . . . . . . . . . . . . . . . Oceania . . . . . . . . . . . . . . . . . . . . . . . . . . . . . . Commonwealth of Independent States . . Commonwealth of Independent States, Asia . . . . . . . . . . . Commonwealth of Independent States, Europe . . . . . . . . Developed regions . . . . . . . . . . . . . . . . . . . . . .
1991
2000
2007
0.83 0.75 0.79 0.76 1.01 0.78 0.99 0.60 0.63 0.90 0.69 0.82 1.03
0.93 0.90 0.95 0.81 1.06 0.97 1.01 0.77 0.91 0.98 0.80 0.91 1.00
0.95 0.94 0.98 0.79 1.07 1.01 0.97 0.85 0.92 1.03 0.84 0.87 0.98
0.98
0.98
0.97
1.06 1.01
1.02 1.01
0.98 1.00
Least developed countries . . . . . . . . . . . . . . . Landlocked developing countries . . . . . . . . Small island developing States . . . . . . . . . . .
1991
2000
2007
0.58 0.85 1.05
0.82 0.87 1.04
0.81 0.84 1.03
Using gross enrolment ratios.
a
a (c) Tertiary
World . . . . . . . . . . . . . . . . . . . . . . . . . . . . . . . . . . . . . . . . . Developing regions . . . . . . . . . . . . . . . . . . . . . . . . . Northern Africa . . . . . . . . . . . . . . . . . . . . . . . . . . Sub-Saharan Africa . . . . . . . . . . . . . . . . . . . . . . Latin America and the Caribbean . . . . . . . . Eastern Asia . . . . . . . . . . . . . . . . . . . . . . . . . . . . . Eastern Asia excluding China . . . . . . . . . . Southern Asia . . . . . . . . . . . . . . . . . . . . . . . . . . . Southern Asia excluding India . . . . . . . . . South-Eastern Asia . . . . . . . . . . . . . . . . . . . . . . Western Asia . . . . . . . . . . . . . . . . . . . . . . . . . . . . Oceania . . . . . . . . . . . . . . . . . . . . . . . . . . . . . . . . . Commonwealth of Independent States . . . . . Commonwealth of Independent States, Asia . . . . . . . . . . . . . . . Commonwealth of Independent States, Europe . . . . . . . . . . . . Developed regions . . . . . . . . . . . . . . . . . . . . . . . . . Least developed countries . . . . . . . . . . . . . . . . . . Landlocked developing countries . . . . . . . . . . . Small island developing States . . . . . . . . . . . . . .
1991
2000
2007
— — 0.54 — — — — — — 0.83 — — 1.16
0.95 0.77 0.68 0.63 1.13 0.55 0.60 0.67 0.73 0.90 0.82 0.68 1.21
1.08 0.96 1.04 0.67 1.19 0.96 0.68 0.77 0.88 1.11 0.93 0.85 1.29
1.04 0.91 1.07 1.20 1.07 — 0.86 —
1.27 1.20 0.53 0.75 1.21
1.33 1.29 0.58 0.80 1.55
a
Using gross enrolment ratios.
Indicator 3.2
Share of women in wage employment in the non-agricultural sector (Percentage of employees) World . . . . . . . . . . . . . . . . . . . . . . . . . . . . . . . . . Developing regions . . . . . . . . . . . . . . . . . Northern Africa . . . . . . . . . . . . . . . . . . Sub-Saharan Africa . . . . . . . . . . . . . . Latin America and the Caribbean Eastern Asia . . . . . . . . . . . . . . . . . . . . . Eastern Asia excluding China Southern Asia . . . . . . . . . . . . . . . . . . . Southern Asia excluding India South-Eastern Asia . . . . . . . . . . . . . . Western Asia . . . . . . . . . . . . . . . . . . . . Oceania . . . . . . . . . . . . . . . . . . . . . . . . . Commonwealth of Independent States . . . . . . . . . . . . . . . Commonwealth of Independent States, Asia . . . . . . . Commonwealth of Independent States, Europe Developed regions . . . . . . . . . . . . . . . . .
1990
2000
2005
2007
35.3 31.5 21.0 22.8 36.5 38.0 39.3 13.4 15.0 35.6 17.3 32.8
37.6 33.5 19.8 26.2 40.7 39.6 41.9 17.2 18.5 37.4 19.6 35.1
38.6 34.3 19.5 28.0 42.1 40.9 43.8 18.3 18.7 37.0 20.7 35.6
39.0 34.7 20.4 28.9 42.7 41.3 44.2 18.8 18.3 37.4 21.2 35.8
49.5
50.2
51.0
51.1
45.4
45.5
46.2
46.2
50.3 43.4
51.2 45.4
52.1 46.4
52.1 46.5
Indicator 3.3
Proportion of seats held by women in national parliamenta (Percentage) World . . . . . . . . . . . . . . . . . . . . . . . . . . . . . . . . . . . Developing regions . . . . . . . . . . . . . . . . . . . Northern Africa . . . . . . . . . . . . . . . . . . . . Sub-Saharan Africa . . . . . . . . . . . . . . . . Latin America and the Caribbean . . Caribbean . . . . . . . . . . . . . . . . . . . . . . .
1990
2000
2005 2009 b
12.8 10.4 2.6 7.2 11.9 22.1
12.5 10.8 2.1 9.1 14.8 19.9
15.6 13.9 5.4 14.2 19.0 26.0
18.5 17.2 8.3 18.1 22.2 29.4