Yearbook of the United Nations, 2009
22 1991 2000 2007 Boys Girls Boys Girls Boys Girls
Commonwealth of Independent States . . . . . Commonwealth of Independent States, Asia Commonwealth of Independent States, Europe . . . . . . . . . . . . . . . Developed regions . . . . . . . . Least developed countries . Landlocked developing countries . . . . Small island developing States . . . . . . .
90.2 89.8 90.8 90.2 93.8 93.4
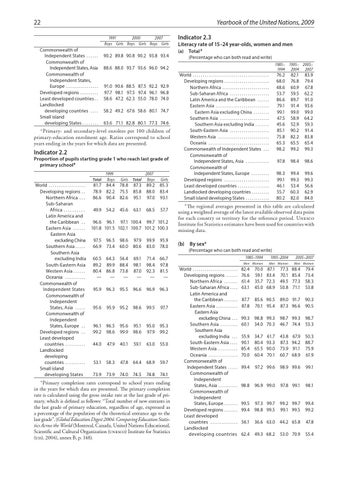
Literacy rate of 15–24 year-olds, women and men a (a) Total
(Percentage who can both read and write) 1985– 1994
88.6 88.0 93.7 93.6 96.0 94.2
91.0 90.6 88.5 87.5 92.2 92.9 97.7 98.1 97.5 97.4 96.1 96.8 58.6 47.2 62.3 55.0 78.0 74.0 58.2 49.2 67.6 58.6 80.1 74.7 63.6 71.1 82.8 80.1 77.3 74.6
a
Primary- and secondary-level enrolees per 100 children of primary-education enrolment age. Ratios correspond to school years ending in the years for which data are presented.
Indicator 2.2
Proportion of pupils starting grade 1 who reach last grade of primary schoola
World . . . . . . . . . . . . . . . . . . . Developing regions . . . Northern Africa . . . . Sub-Saharan Africa . . . . . . . . . . . Latin America and the Caribbean . . . Eastern Asia . . . . . . . Eastern Asia excluding China Southern Asia . . . . . . Southern Asia excluding India South-Eastern Asia Western Asia . . . . . . . Oceania . . . . . . . . . . . Commonwealth of Independent States Commonwealth of Independent States, Asia . . . . . . Commonwealth of Independent States, Europe . . . Developed regions . . . Least developed countries . . . . . . . . . . . Landlocked developing countries . . . . . . . . . . . Small island developing States
Indicator 2.3
Total
1999 Boys
Girls
Total
2007 Boys
Girls
81.7 78.9 86.6
84.4 82.2 90.4
78.8 75.5 82.6
87.3 85.8 95.1
89.2 88.0 97.0
85.3 83.4 93.1
49.9
54.2
45.6
63.1
68.5
57.7
96.6 96.1 97.1 100.4 99.7 101.2 101.8 101.5 102.1 100.7 101.2 100.3 97.5 66.9
96.5 73.4
98.6 60.0
97.9 80.6
99.9 83.0
95.9 78.0
60.5 89.2 80.4 —
64.3 89.9 86.8 —
56.4 88.4 73.8 —
69.1 98.1 87.0 —
71.4 98.4 92.3 —
66.7 97.8 81.5 —
95.9
96.3
95.5
96.6
96.9
96.3
95.6
95.9
95.2
98.6
99.5
97.7
96.1 99.2
96.5 98.6
95.6 99.9
95.1 98.6
95.0 97.9
95.3 99.2
44.0
47.9
40.1
59.1
63.0
55.0
53.1
58.3
47.8
64.4
68.9
59.7
73.9
73.9
74.0
74.5
74.8
74.1
a Primary completion rates correspond to school years ending in the years for which data are presented. The primary completion rate is calculated using the gross intake rate at the last grade of primary, which is defined as follows: “Total number of new entrants in the last grade of primary education, regardless of age, expressed as a percentage of the population of the theoretical entrance age to the last grade”. (Global Education Digest 2004: Comparing Education Statistics Across the World (Montreal, Canada, United Nations Educational, Scientific and Cultural Organization (unesco) Institute for Statistics (uis), 2004), annex B, p. 148).
World . . . . . . . . . . . . . . . . . . . . . . . . . . . . . . . . . . . . . . . . Developing regions . . . . . . . . . . . . . . . . . . . . . . . . Northern Africa . . . . . . . . . . . . . . . . . . . . . . . . . Sub-Saharan Africa . . . . . . . . . . . . . . . . . . . . . Latin America and the Caribbean . . . . . . . Eastern Asia . . . . . . . . . . . . . . . . . . . . . . . . . . . . Eastern Asia excluding China . . . . . . . . . Southern Asia . . . . . . . . . . . . . . . . . . . . . . . . . . Southern Asia excluding India . . . . . . . . South-Eastern Asia . . . . . . . . . . . . . . . . . . . . . Western Asia . . . . . . . . . . . . . . . . . . . . . . . . . . . Oceania . . . . . . . . . . . . . . . . . . . . . . . . . . . . . . . . Commonwealth of Independent States . . . . Commonwealth of Independent States, Asia . . . . . . . . . . . . . Commonwealth of Independent States, Europe . . . . . . . . . . Developed regions . . . . . . . . . . . . . . . . . . . . . . . . Least developed countries . . . . . . . . . . . . . . . . . Landlocked developing countries . . . . . . . . . . Small island developing States . . . . . . . . . . . . .
1995– 2005– 2004 2007
76.2 68.0 48.6 53.7 86.6 79.1 99.1 47.5 45.6 85.1 75.8 65.3 98.2
82.1 76.8 60.9 59.5 89.7 91.4 99.0 58.9 52.9 90.2 82.2 65.5 99.2
83.9 79.4 67.8 62.2 91.0 93.6 99.0 64.2 59.3 91.4 83.8 65.4 99.3
97.8
98.4
98.6
98.3 99.1 46.1 55.7 80.2
99.4 99.3 53.4 60.3 82.0
99.6 99.3 56.6 62.9 84.0
a The regional averages presented in this table are calculated using a weighted average of the latest available observed data point for each country or territory for the reference period. Unesco Institute for Statistics estimates have been used for countries with missing data.
(b) By sexa (Percentage who can both read and write)
World . . . . . . . . . . . . . . . . . . . . . . . . Developing regions . . . . . . . Northern Africa . . . . . . . . Sub-Saharan Africa . . . . . Latin America and the Caribbean . . . . . . . . Eastern Asia . . . . . . . . . . . . Eastern Asia excluding China . . . . Southern Asia . . . . . . . . . . Southern Asia excluding India . . . . South-Eastern Asia. . . . . Western Asia . . . . . . . . . . . Oceania . . . . . . . . . . . . . . . . Commonwealth of Independent States . . . . . . Commonwealth of Independent States, Asia . . . . . . . . . . . Commonwealth of Independent States, Europe . . . . . . . . Developed regions . . . . . . . . Least developed countries . . . . . . . . . . . . . . . Landlocked developing countries
1985–1994
1995–2004
2005–2007
Men Women
Men Women
Men Women
82.4 76.6 61.4 63.1
70.0 59.1 35.7 45.0
87.7 87.8
87.1 83.4 72.3 68.9
88.4 85.4 77.3 71.1
79.4 73.4 58.3 53.8
85.6 90.5 70.1 95.4
89.0 91.7 87.3 96.6
90.3 90.5
99.3 60.1
98.8 99.3 34.0 70.3
98.7 99.3 46.7 74.4
98.7 53.3
55.9 90.1 85.4 70.0
34.7 80.4 65.5 60.4
43.8 87.3 73.9 60.7
67.9 94.2 91.1 68.9
50.3 88.7 75.9 61.9
99.4
97.2 99.6
98.9 99.6
99.1
98.8
96.9 99.0
97.8 99.1
98.1
99.5 99.4
97.3 99.7 98.8 99.5
99.2 99.7 99.1 99.5
99.4 99.2
56.1
36.6 63.0
44.2 65.8
47.8
62.4
49.3 68.2
53.0 70.9
55.4
61.7 93.3 90.0 70.1
77.3 70.1 49.5 50.8