Report of the Secretary-General
21
Eastern Asia . . . . . . . . . . . . . . . . . . . . . . . . . . . . . . . . . . . . . . . . Eastern Asia excluding China . . . . . . . . . . . . . . . . . . . . Southern Asia . . . . . . . . . . . . . . . . . . . . . . . . . . . . . . . . . . . . . . Southern Asia excluding India . . . . . . . . . . . . . . . . . . . South-Eastern Asia . . . . . . . . . . . . . . . . . . . . . . . . . . . . . . . . . Western Asia . . . . . . . . . . . . . . . . . . . . . . . . . . . . . . . . . . . . . . . Oceania . . . . . . . . . . . . . . . . . . . . . . . . . . . . . . . . . . . . . . . . . . . .
1990
2007
17 12 54 67 37 14 —
7 6 48 48 25 14 —
(b) By sex, 2000–2008 (Percentage)
Developing regions . . . . . . . . . . . . . . . . . . . . . . . . . . . . Northern Africa . . . . . . . . . . . . . . . . . . . . . . . . . . . . . . Sub-Saharan Africa . . . . . . . . . . . . . . . . . . . . . . . . . . Latin America and the Caribbean . . . . . . . . . . . . Eastern Asia . . . . . . . . . . . . . . . . . . . . . . . . . . . . . . . . . Eastern Asia excluding China . . . . . . . . . . . . . Southern Asia . . . . . . . . . . . . . . . . . . . . . . . . . . . . . . . Southern Asia excluding India . . . . . . . . . . . . South-Eastern Asia . . . . . . . . . . . . . . . . . . . . . . . . . . Western Asia . . . . . . . . . . . . . . . . . . . . . . . . . . . . . . . . . Oceania . . . . . . . . . . . . . . . . . . . . . . . . . . . . . . . . . . . . . Commonwealth of Independent States . . . . . . . . . Commonwealth of Independent States, Asia Commonwealth of Independent States, Europe . . . . . . . . . . . . . . . Transition countries of South-Eastern Europe
Boys
Girls
Boyto-girl ratio
34 — 28 — — 22 45 41 25 14 — 5 7
34 — 27 — — 21 47 42 25 14 — 5 7
0.99 — 1.06 — — 1.06 0.95 0.98 0.99 1.00 — 0.97 1.00
— 3
— 3
— 1.02
(c) By residence, 2000–2008 (Percentage)
Rural Urban
Developing regions . . . . . . . . . . . . . . . . . . . . . . . . . . . . . . . . . . Northern Africa . . . . . . . . . . . . . . . . . . . . . . . . . . . . . . . . . . . . Sub-Saharan Africa . . . . . . . . . . . . . . . . . . . . . . . . . . . . . . . . Latin America and the Caribbean . . . . . . . . . . . . . . . . . . Eastern Asia . . . . . . . . . . . . . . . . . . . . . . . . . . . . . . . . . . . . . . . Eastern Asia excluding China . . . . . . . . . . . . . . . . . . . Southern Asia . . . . . . . . . . . . . . . . . . . . . . . . . . . . . . . . . . . . . Southern Asia excluding India . . . . . . . . . . . . . . . . . . South-Eastern Asia . . . . . . . . . . . . . . . . . . . . . . . . . . . . . . . . Western Asia . . . . . . . . . . . . . . . . . . . . . . . . . . . . . . . . . . . . . . . Oceania . . . . . . . . . . . . . . . . . . . . . . . . . . . . . . . . . . . . . . . . . . . Commonwealth of Independent States . . . . . . . . . . . . . . . Commonwealth of Independent States, Asia . . . . . . . Transition countries of South-Eastern Europe . . . . . . . . .
30 8 30 12 9 6 48 37 26 18 — — 8
17 5 19 5 2 7 35 44 21 7 — — 5
3
3
Indicator 1.9
Proportion of population below minimum level of dietary energy consumption 1990– 2004– 1992 2006
World . . . . . . . . . . . . . . . . . . . . . . . . . . . . . . . . . . . . . . . . . . Developing regions . . . . . . . . . . . . . . . . . . . . . . . . . . Northern Africa . . . . . . . . . . . . . . . . . . . . . . . . . . . Sub-Saharan Africa . . . . . . . . . . . . . . . . . . . . . . . Latin America and the Caribbean . . . . . . . . . Eastern Asia . . . . . . . . . . . . . . . . . . . . . . . . . . . . . . Eastern Asia excluding China . . . . . . . . . . . Southern Asia . . . . . . . . . . . . . . . . . . . . . . . . . . . . Southern Asia excluding India . . . . . . . . . . South-Eastern Asia . . . . . . . . . . . . . . . . . . . . . . . Western Asia . . . . . . . . . . . . . . . . . . . . . . . . . . . . . Oceania . . . . . . . . . . . . . . . . . . . . . . . . . . . . . . . . . . Commonwealth of Independent States . . . . . . Commonwealth of Independent States, Asia . . . . . . . . . . . . . .
2008
16 20 <5 32 12 15 8 24 24 24 6 12 6
13 16 <5 28 8 10 12 22 22 15 8 13 <5
14 17 <5 29 8 10 13 21 22 15 8 15 <5
15
11
9
1990– 2004– 1992 2006
Commonwealth of Independent States, Europe . . . . . . . . . . . Developed regions . . . . . . . . . . . . . . . . . . . . . . . . . . Transition countries of South-Eastern Europe . . . . . . . . . . . . . . . . . . . . . . . . . . . . . . . . Least developed countries . . . . . . . . . . . . . . . . . . . Landlocked developing countries . . . . . . . . . . . . Small island developing States . . . . . . . . . . . . . . .
2008
<5 <5
<5 <5
<5 <5
5 39 34
<5 34 27
<5 34 28
23
21
21
Goal 2 Achieve universal primary education Target 2.A
Ensure that, by 2015, children everywhere, boys and girls alike, will be able to complete a full course of primary schooling
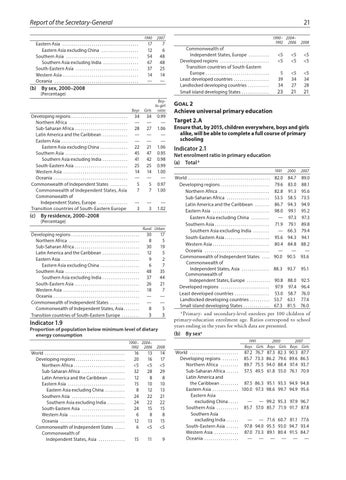
Indicator 2.1
Net enrolment ratio in primary education a (a) Total 1991
World . . . . . . . . . . . . . . . . . . . . . . . . . . . . . . . . . . . . . . . . . . Developing regions . . . . . . . . . . . . . . . . . . . . . . . . . Northern Africa . . . . . . . . . . . . . . . . . . . . . . . . . . Sub-Saharan Africa . . . . . . . . . . . . . . . . . . . . . . Latin America and the Caribbean . . . . . . . . Eastern Asia . . . . . . . . . . . . . . . . . . . . . . . . . . . . . Eastern Asia excluding China . . . . . . . . . . Southern Asia . . . . . . . . . . . . . . . . . . . . . . . . . . . . Southern Asia excluding India . . . . . . . . . South-Eastern Asia . . . . . . . . . . . . . . . . . . . . . . Western Asia . . . . . . . . . . . . . . . . . . . . . . . . . . . . . Oceania . . . . . . . . . . . . . . . . . . . . . . . . . . . . . . . . . Commonwealth of Independent States . . . . . Commonwealth of Independent States, Asia . . . . . . . . . . . . . . . Commonwealth of Independent States, Europe . . . . . . . . . . . . Developed regions . . . . . . . . . . . . . . . . . . . . . . . . . Least developed countries . . . . . . . . . . . . . . . . . . Landlocked developing countries . . . . . . . . . . . Small island developing States . . . . . . . . . . . . . .
2000
2007
82.0 84.7 89.0 79.6 83.0 88.1 82.8 91.3 95.6 53.5 58.5 73.5 86.7 94.3 94.9 98.0 99.1 95.2 — 97.3 97.3 71.9 79.1 89.8 — 66.3 79.4 95.6 94.3 94.1 80.4 84.8 88.2 — — — 90.0 90.5 93.6 88.3
93.7
95.1
90.8 88.0 92.5 97.9 97.4 96.4 53.0 58.7 76.0 53.7 63.1 77.4 67.3 81.5 76.0
a Primary- and secondary-level enrolees per 100 children of primary-education enrolment age. Ratios correspond to school years ending in the years for which data are presented. (b) By sexa
1991 2000 2007 Boys Girls Boys Girls Boys Girls
World . . . . . . . . . . . . . . . . . . . . . . . . . 87.2 76.7 87.3 82.3 90.3 Developing regions . . . . . . . . 85.7 73.3 86.2 79.6 89.6 Northern Africa . . . . . . . . . 89.7 75.5 94.0 88.4 97.4 Sub-Saharan Africa . . . . . 57.5 49.5 61.8 55.0 76.1 Latin America and the Caribbean . . . . . . . . 87.5 86.3 95.1 93.5 94.9 Eastern Asia . . . . . . . . . . . . 100.0 97.3 98.6 99.7 94.9 Eastern Asia — — 99.2 95.3 97.9 excluding China . . . . Southern Asia . . . . . . . . . . . 85.7 57.0 85.7 71.9 91.7 Southern Asia — — 71.6 60.7 81.1 excluding India . . . . . South-Eastern Asia . . . . . . 97.8 94.0 95.5 93.0 94.7 Western Asia . . . . . . . . . . . . 87.0 73.3 89.1 80.4 91.5 Oceania . . . . . . . . . . . . . . . . — — — — —
87.7 86.5 93.7 70.9 94.8 95.6 96.7 87.8 77.6 93.4 84.7 —