Yearbook of the United Nations, 2009
20 Men Women
Developed regions . . . . . . . . . . . . . . . . . . . . . . . Transition countries in South-Eastern Europe . . . . . . . . . . . . Least developed countries . . . . . . . . . . . . . . . . Landlocked developing countries . . . . . . . . . Small island developing States . . . . . . . . . . . .
Youth
63.6
48.9
42.9
54.7 79.6 75.7 69.7
41.6 58.8 60.2 45.3
25.3 57.1 54.9 40.7
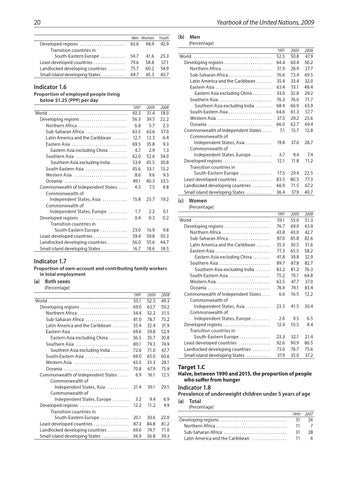
Indicator 1.6 Proportion of employed people living below $1.25 (PPP) per day World . . . . . . . . . . . . . . . . . . . . . . . . . . . . . . . . . . . . . . . . Developing regions . . . . . . . . . . . . . . . . . . . . . . . . Northern Africa . . . . . . . . . . . . . . . . . . . . . . . . . Sub-Saharan Africa . . . . . . . . . . . . . . . . . . . . . Latin America and the Caribbean . . . . . . . Eastern Asia . . . . . . . . . . . . . . . . . . . . . . . . . . . . Eastern Asia excluding China . . . . . . . . . Southern Asia . . . . . . . . . . . . . . . . . . . . . . . . . . Southern Asia excluding India . . . . . . . . South-Eastern Asia . . . . . . . . . . . . . . . . . . . . . Western Asia . . . . . . . . . . . . . . . . . . . . . . . . . . . Oceania . . . . . . . . . . . . . . . . . . . . . . . . . . . . . . . . Commonwealth of Independent States . . . . Commonwealth of Independent States, Asia . . . . . . . . . . . . Commonwealth of Independent States, Europe . . . . . . . . . Developed regions . . . . . . . . . . . . . . . . . . . . . . . . Transition countries in South-Eastern Europe . . . . . . . . . . . . . Least developed countries . . . . . . . . . . . . . . . . . Landlocked developing countries . . . . . . . . . . Small island developing States . . . . . . . . . . . . .
1991
2000
2008
43.3 56.3 6.8 63.5 12.7 69.5 4.7 62.0 53.9 45.6 8.6 49.1 4.5
31.4 39.5 5.7 63.6 12.3 35.8 2.9 52.6 45.5 33.1 9.6 40.3 7.5
18.0 22.2 2.3 57.0 6.4 9.3 1.3 34.0 30.8 15.2 9.3 33.5 4.8
15.8
25.7
19.2
1.7 0.4
2.2 0.3
0.1 0.2
23.0 59.4 56.0 16.7
16.9 59.8 55.6 18.6
9.8 50.3 44.7 18.5
Indicator 1.7 Proportion of own-account and contributing family workers in total employment
(a) Both sexes (Percentage) World . . . . . . . . . . . . . . . . . . . . . . . . . . . . . . . . . . . . . . . . . Developing regions . . . . . . . . . . . . . . . . . . . . . . . . . Northern Africa . . . . . . . . . . . . . . . . . . . . . . . . . . Sub-Saharan Africa . . . . . . . . . . . . . . . . . . . . . . Latin America and the Caribbean . . . . . . . . Eastern Asia . . . . . . . . . . . . . . . . . . . . . . . . . . . . . Eastern Asia excluding China . . . . . . . . . . Southern Asia . . . . . . . . . . . . . . . . . . . . . . . . . . . Southern Asia excluding India . . . . . . . . . South-Eastern Asia . . . . . . . . . . . . . . . . . . . . . . Western Asia . . . . . . . . . . . . . . . . . . . . . . . . . . . . Oceania . . . . . . . . . . . . . . . . . . . . . . . . . . . . . . . . . Commonwealth of Independent States . . . . . Commonwealth of Independent States, Asia . . . . . . . . . . . Commonwealth of Independent States, Europe . . . . . . . . Developed regions . . . . . . . . . . . . . . . . . . . . . . . . . Transition countries in South-Eastern Europe . . . . . . . . . . . . . . Least developed countries . . . . . . . . . . . . . . . . . . Landlocked developing countries . . . . . . . . . . . Small island developing States . . . . . . . . . . . . . .
1991
2000
2008
55.1 69.0 34.4 81.0 35.4 69.6 36.5 80.1 72.6 69.0 43.5 70.8 6.9
52.5 63.7 32.2 78.7 32.4 59.8 35.7 79.3 71.0 65.0 33.3 67.9 16.1
49.3 59.2 31.5 75.2 31.9 52.9 30.8 74.9 67.7 60.6 28.1 75.9 12.5
21.4
39.1
29.5
3.2 12.2
9.4 11.2
6.9 9.9
20.1 87.3 69.6 36.9
30.6 84.8 74.7 36.8
22.0 81.2 71.0 39.3
(b) Men (Percentage) World . . . . . . . . . . . . . . . . . . . . . . . . . . . . . . . . . . . . . . . . Developing regions . . . . . . . . . . . . . . . . . . . . . . . . Northern Africa . . . . . . . . . . . . . . . . . . . . . . . . . Sub-Saharan Africa . . . . . . . . . . . . . . . . . . . . . Latin America and the Caribbean . . . . . . . Eastern Asia . . . . . . . . . . . . . . . . . . . . . . . . . . . . Eastern Asia excluding China . . . . . . . . . Southern Asia . . . . . . . . . . . . . . . . . . . . . . . . . . Southern Asia excluding India . . . . . . . . South-Eastern Asia . . . . . . . . . . . . . . . . . . . . . Western Asia . . . . . . . . . . . . . . . . . . . . . . . . . . . Oceania . . . . . . . . . . . . . . . . . . . . . . . . . . . . . . . . Commonwealth of Independent States . . . . Commonwealth of Independent States, Asia . . . . . . . . . . . . Commonwealth of Independent States, Europe . . . . . . . . . Developed regions . . . . . . . . . . . . . . . . . . . . . . . . Transition countries in South-Eastern Europe . . . . . . . . . . . . . . . Least developed countries . . . . . . . . . . . . . . . . . Landlocked developing countries . . . . . . . . . . Small island developing States . . . . . . . . . . . . .
1991
2000
2008
52.5 64.4 31.9 76.6 35.4 63.4 33.0 76.3 68.4 64.6 37.5 66.0 7.1
50.8 60.4 28.9 73.4 33.4 55.1 32.8 76.0 66.9 61.3 29.2 62.7 15.7
47.9 56.2 27.7 69.5 32.0 48.4 29.2 71.7 63.9 57.7 25.6 69.4 12.8
19.8
37.0
28.7
3.7 12.1
9.4 11.8
7.4 11.2
17.5 83.5 66.9 36.4
29.4 80.5 71.5 37.9
22.5 77.3 67.2 40.7
(c) Women (Percentage) World . . . . . . . . . . . . . . . . . . . . . . . . . . . . . . . . . . . . . . . . Developing regions . . . . . . . . . . . . . . . . . . . . . . . . Northern Africa . . . . . . . . . . . . . . . . . . . . . . . . . Sub-Saharan Africa . . . . . . . . . . . . . . . . . . . . . Latin America and the Caribbean . . . . . . . Eastern Asia . . . . . . . . . . . . . . . . . . . . . . . . . . . . Eastern Asia excluding China . . . . . . . . . Southern Asia . . . . . . . . . . . . . . . . . . . . . . . . . . Southern Asia excluding India . . . . . . . . South-Eastern Asia . . . . . . . . . . . . . . . . . . . . . Western Asia . . . . . . . . . . . . . . . . . . . . . . . . . . . Oceania . . . . . . . . . . . . . . . . . . . . . . . . . . . . . . . . Commonwealth of Independent States . . . . Commonwealth of Independent States, Asia . . . . . . . . . . . . Commonwealth of Independent States, Europe . . . . . . . . . Developed regions . . . . . . . . . . . . . . . . . . . . . . . . Transition countries in South-Eastern Europe . . . . . . . . . . . . . . . Least developed countries . . . . . . . . . . . . . . . . . Landlocked developing countries . . . . . . . . . . Small island developing States . . . . . . . . . . . . .
1991
2000
2008
59.1 76.7 43.8 87.0 35.3 77.3 41.8 89.7 83.2 75.2 63.5 76.9 6.6
55.0 69.0 43.0 85.8 30.5 65.5 39.8 87.8 81.2 70.1 47.7 74.1 16.5
51.3 63.9 42.7 82.6 31.6 58.2 32.9 82.7 76.3 64.8 37.0 83.4 12.2
23.3
41.5
30.4
2.6 12.4
9.5 10.5
6.5 8.4
23.3 92.6 73.0 37.9
32.1 90.9 78.7 35.0
21.4 86.5 75.6 37.2
Target 1.C
Halve, between 1990 and 2015, the proportion of people who suffer from hunger
Indicator 1.8
Prevalence of underweight children under 5 years of age (a) Total (Percentage)
Developing regions . . . . . . . . . . . . . . . . . . . . . . . . . . . . . . . . . . . Northern Africa . . . . . . . . . . . . . . . . . . . . . . . . . . . . . . . . . . . . . Sub-Saharan Africa . . . . . . . . . . . . . . . . . . . . . . . . . . . . . . . . . Latin America and the Caribbean . . . . . . . . . . . . . . . . . . .
1990
2007
31 11 31 11
26 7 28 6