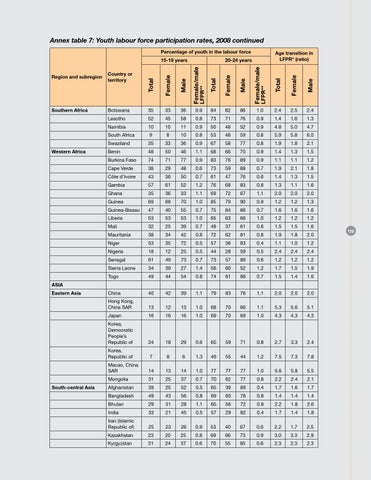
Annex table 7: Youth labour force participation rates, 2008 continued Percentage of youth in the labour force 15-19 years
Age transition in LFPR* (ratio)
20-24 years
Region and subregion
Country or territory
Southern Africa
Botswana
35
33
36
0.9
84
82
86
1.0
2.4
2.5
2.4
Lesotho
52
45
58
0.8
73
71
76
0.9
1.4
1.6
1.3
Namibia
10
10
11
0.9
50
48
52
0.9
4.8
5.0
4.7
South Africa
9
8
10
0.8
53
48
59
0.8
5.9
5.8
6.0
Swaziland
35
33
36
0.9
67
58
77
0.8
1.9
1.8
2.1
Benin
48
50
46
1.1
68
66
70
0.9
1.4
1.3
1.5
Burkina Faso
74
71
77
0.9
83
76
89
0.9
1.1
1.1
1.2
Cape Verde
38
29
48
0.6
73
59
88
0.7
1.9
2.1
1.8
Côte d’Ivoire
43
36
50
0.7
61
47
76
0.6
1.4
1.3
1.5
Gambia
57
61
52
1.2
76
68
83
0.8
1.3
1.1
1.6
Ghana
35
36
33
1.1
69
72
67
1.1
2.0
2.0
2.0
Guinea
69
69
70
1.0
85
79
90
0.9
1.2
1.2
1.3
Guinea-Bissau
47
40
55
0.7
75
64
86
0.7
1.6
1.6
1.6
Liberia
53
53
53
1.0
65
63
66
1.0
1.2
1.2
1.2
Mali
32
25
39
0.7
49
37
61
0.6
1.5
1.5
1.6
Mauritania
38
34
42
0.8
72
62
81
0.8
1.9
1.8
2.0
Niger
53
35
72
0.5
57
36
83
0.4
1.1
1.0
1.2
Nigeria
18
12
25
0.5
44
28
59
0.5
2.4
2.4
2.4
Senegal
61
49
73
0.7
73
57
89
0.6
1.2
1.2
1.2
Sierra Leone
34
39
27
1.4
56
60
52
1.2
1.7
1.5
1.9
Togo
49
44
54
0.8
74
61
88
0.7
1.5
1.4
1.6
China
40
42
39
1.1
79
83
76
1.1
2.0
2.0
2.0
Hong Kong, China SAR
13
12
13
1.0
68
70
66
1.1
5.3
5.6
5.1
Japan
16
16
16
1.0
69
70
69
1.0
4.3
4.3
4.3
Korea, Democratic People’s Republic of
24
18
29
0.6
65
59
71
0.8
2.7
3.3
2.4
Korea, Republic of
7
8
6
1.3
49
55
44
1.2
7.5
7.3
7.8
Macao, China SAR
14
13
14
1.0
77
77
77
1.0
5.6
5.8
5.5
Mongolia
31
25
37
0.7
70
62
77
0.8
2.2
2.4
2.1
Afghanistan
39
25
52
0.5
65
39
89
0.4
1.7
1.6
1.7
Bangladesh
49
43
56
0.8
69
60
78
0.8
1.4
1.4
1.4
Bhutan
29
31
28
1.1
65
56
72
0.8
2.2
1.8
2.6
India
33
21
45
0.5
57
29
82
0.4
1.7
1.4
1.8
Iran (Islamic Republic of)
25
23
26
0.9
53
40
67
0.6
2.2
1.7
2.5
Kazakhstan
23
20
25
0.8
69
66
73
0.9
3.0
3.3
2.9
Kyrgyzstan
31
24
37
0.6
70
55
85
0.6
2.3
2.3
2.3
Western Africa
ASIA Eastern Asia
South-central Asia
139