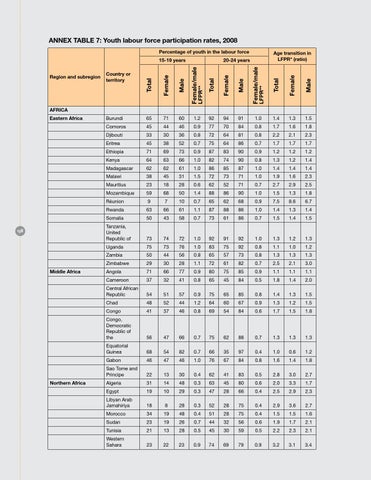
Annex table 7: Youth labour force participation rates, 2008 Percentage of youth in the labour force 15-19 years Region and subregion
Age transition in LFPR* (ratio)
20-24 years
Country or territory
AFRICA Eastern Africa
138
Middle Africa
Northern Africa
Burundi
65
71
60
1.2
92
94
91
1.0
1.4
1.3
1.5
Comoros
45
44
46
0.9
77
70
84
0.8
1.7
1.6
1.8
Djibouti
33
30
36
0.8
72
64
81
0.8
2.2
2.1
2.3
Eritrea
45
38
52
0.7
75
64
86
0.7
1.7
1.7
1.7
Ethiopia
71
69
73
0.9
87
83
90
0.9
1.2
1.2
1.2
Kenya
64
63
66
1.0
82
74
90
0.8
1.3
1.2
1.4
Madagascar
62
62
61
1.0
86
85
87
1.0
1.4
1.4
1.4
Malawi
38
45
31
1.5
72
73
71
1.0
1.9
1.6
2.3
Mauritius
23
18
28
0.6
62
52
71
0.7
2.7
2.9
2.5
Mozambique
59
68
50
1.4
88
86
90
1.0
1.5
1.3
1.8
RĂŠunion
9
7
10
0.7
65
62
68
0.9
7.5
8.6
6.7
Rwanda
63
66
61
1.1
87
88
86
1.0
1.4
1.3
1.4
Somalia
50
43
58
0.7
73
61
86
0.7
1.5
1.4
1.5
Tanzania, United Republic of
73
74
72
1.0
92
91
92
1.0
1.3
1.2
1.3
Uganda
75
73
76
1.0
83
75
92
0.8
1.1
1.0
1.2
Zambia
50
44
56
0.8
65
57
73
0.8
1.3
1.3
1.3
Zimbabwe
29
30
28
1.1
72
61
82
0.7
2.5
2.1
3.0
Angola
71
66
77
0.9
80
75
85
0.9
1.1
1.1
1.1
Cameroon
37
32
41
0.8
65
45
84
0.5
1.8
1.4
2.0
Central African Republic
54
51
57
0.9
75
65
85
0.8
1.4
1.3
1.5
Chad
48
52
44
1.2
64
60
67
0.9
1.3
1.2
1.5
Congo
41
37
46
0.8
69
54
84
0.6
1.7
1.5
1.8
Congo, Democratic Republic of the
56
47
66
0.7
75
62
88
0.7
1.3
1.3
1.3
Equatorial Guinea
68
54
82
0.7
66
35
97
0.4
1.0
0.6
1.2
Gabon
46
47
46
1.0
76
67
84
0.8
1.6
1.4
1.8
Sao Tome and Principe
22
13
30
0.4
62
41
83
0.5
2.8
3.0
2.7
Algeria
31
14
48
0.3
63
45
80
0.6
2.0
3.3
1.7
Egypt
19
10
29
0.3
47
28
66
0.4
2.5
2.9
2.3
Libyan Arab Jamahiriya
18
8
28
0.3
52
28
75
0.4
2.9
3.6
2.7
Morocco
34
19
48
0.4
51
28
75
0.4
1.5
1.5
1.6
Sudan
23
19
26
0.7
44
32
56
0.6
1.9
1.7
2.1
Tunisia
21
13
28
0.5
45
30
59
0.5
2.2
2.3
2.1
Western Sahara
23
22
23
0.9
74
69
79
0.9
3.2
3.1
3.4