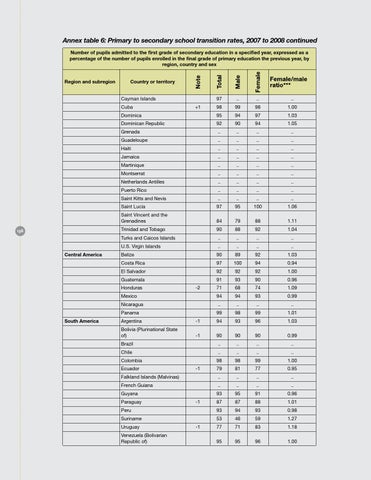
Annex table 6: Primary to secondary school transition rates, 2007 to 2008 continued Number of pupils admitted to the first grade of secondary education in a specified year, expressed as a percentage of the number of pupils enrolled in the final grade of primary education the previous year, by region, country and sex Region and subregion
Country or territory Cayman Islands
97
..
..
..
98
99
98
1.00
Dominica
95
94
97
1.03
Dominican Republic
92
90
94
1.05
Grenada
..
..
..
..
Guadeloupe
..
..
..
..
Haiti
..
..
..
..
Jamaica
..
..
..
..
Martinique
..
..
..
..
Montserrat
..
..
..
..
Netherlands Antilles
..
..
..
..
Puerto Rico
..
..
..
..
Saint Kitts and Nevis
..
..
..
..
Saint Lucia
97
95
100
1.06
Saint Vincent and the Grenadines
84
79
88
1.11
Trinidad and Tobago
90
88
92
1.04
Turks and Caicos Islands
..
..
..
..
Cuba
136
Central America
+1
U.S. Virgin Islands
..
..
..
..
Belize
90
89
92
1.03
Costa Rica
97
100
94
0.94
El Salvador
92
92
92
1.00
Guatemala Honduras
-2
Mexico
South America
91
93
90
0.96
71
68
74
1.09
94
94
93
0.99
Nicaragua
..
..
..
..
Panama
99
98
99
1.01
Argentina
-1
94
93
96
1.03
Bolivia (Plurinational State of)
-1
90
90
90
0.99
..
..
..
..
Brazil Chile
..
..
..
..
Colombia
98
98
99
1.00
79
81
77
0.95
Falkland Islands (Malvinas)
..
..
..
..
French Guiana
..
..
..
..
Ecuador
-1
Guyana Paraguay
-1
Peru Suriname Uruguay Venezuela (Bolivarian Republic of)
-1
93
95
91
0.96
87
87
88
1.01
93
94
93
0.98
53
46
59
1.27
77
71
83
1.18
95
95
96
1.00