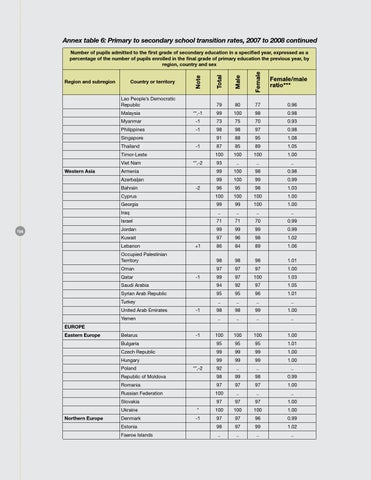
Annex table 6: Primary to secondary school transition rates, 2007 to 2008 continued Number of pupils admitted to the first grade of secondary education in a specified year, expressed as a percentage of the number of pupils enrolled in the final grade of primary education the previous year, by region, country and sex Region and subregion
Country or territory Lao People’s Democratic Republic
77
0.96
**,-1
99
100
98
0.98
Myanmar
-1
73
75
70
0.93
Philippines
-1
98
98
97
0.98
91
88
95
1.08
Thailand
-1
87
85
89
1.05
100
100
100
1.00
93
..
..
..
Armenia
99
100
98
0.98
Azerbaijan
99
100
99
0.99
Timor-Leste Viet Nam
Bahrain
134
80
Malaysia
Singapore
Western Asia
79
**,-2
96
95
98
1.03
Cyprus
100
100
100
1.00
Georgia
99
99
100
1.00
Iraq
..
..
..
..
Israel
71
71
70
0.99
Jordan
99
99
99
0.99
Kuwait
97
96
98
1.02
Lebanon
-2
86
84
89
1.06
Occupied Palestinian Territory
98
98
98
1.01
Oman
97
97
97
1.00
Qatar
+1
99
97
100
1.03
Saudi Arabia
-1
94
92
97
1.05
Syrian Arab Republic
95
95
96
1.01
Turkey United Arab Emirates
-1
Yemen
..
..
..
..
98
98
99
1.00
..
..
..
..
EUROPE Eastern Europe
Belarus
100
100
100
1.00
Bulgaria
-1
95
95
95
1.01
Czech Republic
99
99
99
1.00
Hungary
99
99
99
1.00
92
..
..
..
Republic of Moldova
98
99
98
0.99
Romania
97
97
97
1.00
Russian Federation
100
..
..
..
Slovakia
97
97
97
1.00
Poland
Northern Europe
**,-2
Ukraine
*
100
100
100
1.00
Denmark
-1
97
97
96
0.99
Estonia
98
97
99
1.02
Faeroe Islands
..
..
..
..