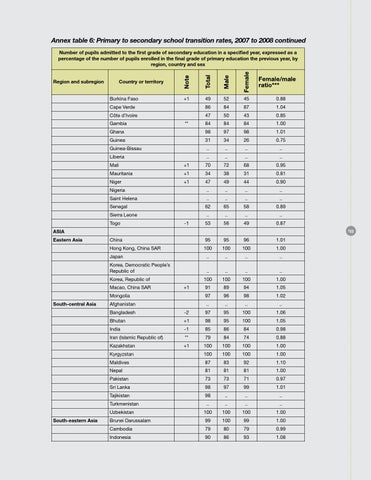
Annex table 6: Primary to secondary school transition rates, 2007 to 2008 continued Number of pupils admitted to the first grade of secondary education in a specified year, expressed as a percentage of the number of pupils enrolled in the final grade of primary education the previous year, by region, country and sex Region and subregion
Country or territory Burkina Faso
+1
Cape Verde Côte d’Ivoire
49
52
45
0.88
86
84
87
1.04
47
50
43
0.85
84
84
84
1.00
Ghana
98
97
98
1.01
Guinea
31
34
26
0.75
Guinea-Bissau
..
..
..
..
Liberia
..
..
..
..
70
72
68
0.95
Gambia
Mali
**
+1
Mauritania
+1
34
38
31
0.81
Niger
+1
47
49
44
0.90
Nigeria
..
..
..
..
Saint Helena
..
..
..
..
Senegal
62
65
58
0.89
Sierra Leone
..
..
..
..
53
56
49
0.87
Togo
-1
133
ASIA Eastern Asia
China
95
95
96
1.01
Hong Kong, China SAR
100
100
100
1.00
..
..
..
..
Japan Korea, Democratic People’s Republic of Korea, Republic of Macao, China SAR
+1
Mongolia South-central Asia
Afghanistan
..
..
..
100
100
1.00
91
89
94
1.05
97
96
98
1.02
..
..
..
..
Bangladesh
-2
97
95
100
1.06 1.05
Bhutan
+1
98
95
100
India
-1
85
86
84
0.98
Iran (Islamic Republic of)
**
79
84
74
0.88
Kazakhstan
+1
100
100
100
1.00
Kyrgyzstan
100
100
100
1.00
Maldives
87
83
92
1.10
Nepal
81
81
81
1.00
Pakistan
73
73
71
0.97
Sri Lanka
98
97
99
1.01
Tajikistan
98
..
..
..
Turkmenistan South-eastern Asia
.. 100
..
..
..
..
Uzbekistan
100
100
100
1.00
Brunei Darussalam
99
100
99
1.00
Cambodia
79
80
79
0.99
Indonesia
90
86
93
1.08