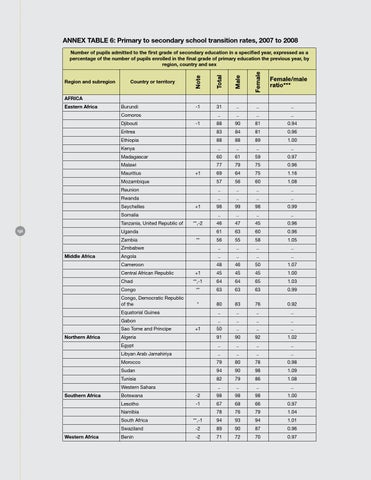
Annex table 6: Primary to secondary school transition rates, 2007 to 2008 Number of pupils admitted to the first grade of secondary education in a specified year, expressed as a percentage of the number of pupils enrolled in the final grade of primary education the previous year, by region, country and sex Region and subregion
Country or territory
AFRICA Eastern Africa
Burundi
-1
31 ..
..
..
..
-1
88
90
81
0.94
Eritrea
83
84
81
0.96
Ethiopia
88
88
89
1.00
Kenya
..
..
..
..
Madagascar
60
61
59
0.97
Malawi
77
79
75
0.96
Comoros Djibouti
Mauritius
64
75
1.16
57
56
60
1.08
Reunion
..
..
..
..
Rwanda
..
..
..
..
+1
98
99
98
0.99
..
..
..
..
**,-2
46
47
45
0.96
61
63
60
0.96
**
56
55
58
1.05
Zimbabwe
..
..
..
..
Angola
..
..
..
..
Cameroon
48
46
50
1.07
Tanzania, United Republic of Uganda Zambia Middle Africa
Central African Republic
+1
45
45
45
1.00
Chad
**,-1
64
64
65
1.03
Congo
**
63
63
63
0.99
Congo, Democratic Republic of the
*
80
83
76
0.92
..
..
..
..
Equatorial Guinea Gabon
..
..
..
..
50
..
..
..
Algeria
91
90
92
1.02
Egypt
..
..
..
..
Libyan Arab Jamahiriya
..
..
..
..
Morocco
79
80
78
0.98
Sudan
94
90
98
1.09
Tunisia
82
79
86
1.08
Western Sahara
..
..
..
..
Sao Tome and Principe Northern Africa
Southern Africa
+1
Botswana
-2
98
98
98
1.00
Lesotho
-1
67
68
66
0.97
78
76
79
1.04
Namibia South Africa Western Africa
..
69
Somalia 132
..
Mozambique
Seychelles
+1
..
**,-1
94
93
94
1.01
Swaziland
-2
89
90
87
0.96
Benin
-2
71
72
70
0.97