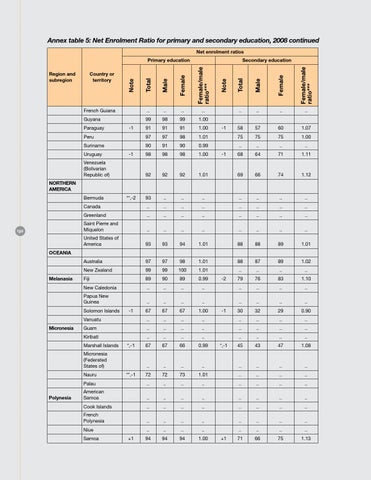
Annex table 5: Net Enrolment Ratio for primary and secondary education, 2008 continued Net enrolment ratios Primary education Region and subregion
Secondary education
Country or territory
French Guiana
..
..
..
..
Guyana
99
98
99
1.00
91
91
91
1.00
Paraguay
-1
-1
..
..
..
..
58
57
60
1.07
Peru
97
97
98
1.01
75
75
75
1.00
Suriname
90
91
90
0.99
..
..
..
..
98
98
98
1.00
68
64
71
1.11
92
92
92
1.01
69
66
74
1.12
Uruguay
-1
Venezuela (Bolivarian Republic of)
-1
NORTHERN AMERICA Bermuda
130
93
..
..
..
..
..
..
..
Canada
**,-2
..
..
..
..
..
..
..
..
Greenland
..
..
..
..
..
..
..
..
Saint Pierre and Miquelon
..
..
..
..
..
..
..
..
United States of America
93
93
94
1.01
88
88
89
1.01
Australia
97
97
98
1.01
88
87
89
1.02
OCEANIA
Melanasia
New Zealand
99
99
100
1.01
Fiji
89
90
89
0.99
New Caledonia
..
..
..
..
Papua New Guinea Solomon Islands
-1
Vanuatu Micronesia
..
..
..
67
67
1.00
..
..
..
..
-1
..
..
..
..
79
76
83
1.10
..
..
..
..
..
..
..
..
30
32
29
0.90
..
..
..
..
Guam
..
..
..
..
..
..
..
..
Kiribati
..
..
..
..
..
..
..
..
67
67
66
0.99
45
43
47
1.08
..
..
..
..
..
..
..
..
Marshall Islands
*,-1
Micronesia (Federated States of) Nauru
Polynesia
.. 67
-2
**,-1
*,-1
72
72
73
1.01
..
..
..
..
Palau
..
..
..
..
..
..
..
..
American Samoa
..
..
..
..
..
..
..
..
Cook Islands
..
..
..
..
..
..
..
..
French Polynesia
..
..
..
..
..
..
..
..
Niue Samoa
+1
..
..
..
..
94
94
94
1.00
+1
..
..
..
..
71
66
75
1.13