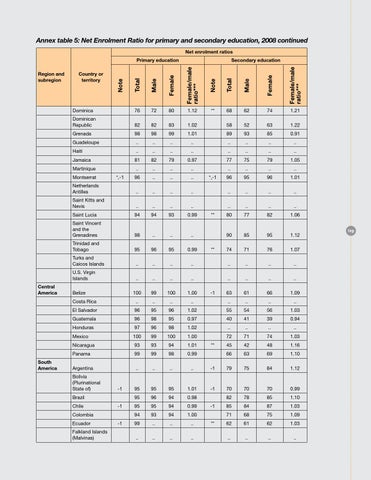
Annex table 5: Net Enrolment Ratio for primary and secondary education, 2008 continued Net enrolment ratios Primary education Region and subregion
Country or territory
Dominica
76
80
1.12
**
68
62
74
1.21
82
82
83
1.02
58
52
63
1.22
Grenada
98
98
99
1.01
89
93
85
0.91
Guadeloupe
..
..
..
..
..
..
..
..
Haiti
..
..
..
..
..
..
..
..
Jamaica
81
82
79
0.97
77
75
79
1.05
Martinique
South America
72
Dominican Republic
..
..
..
..
96
..
..
..
Netherlands Antilles
..
..
..
Saint Kitts and Nevis
..
..
Montserrat
Central America
Secondary education
*,-1
..
..
..
..
96
95
96
1.01
..
..
..
..
..
..
..
..
..
..
..
80
77
82
1.06
90
85
95
1.12
74
71
76
1.07
*,-1
Saint Lucia
94
94
93
0.99
Saint Vincent and the Grenadines
98
..
..
..
Trinidad and Tobago
95
96
95
0.99
Turks and Caicos Islands
..
..
..
..
..
..
..
..
U.S. Virgin Islands
..
..
..
..
..
..
..
..
100
99
100
1.00
63
61
66
1.09
Belize
**
**
-1
Costa Rica
..
..
..
..
..
..
..
..
El Salvador
96
95
96
1.02
55
54
56
1.03
Guatemala
96
98
95
0.97
40
41
39
0.94
Honduras
97
96
98
1.02
..
..
..
..
Mexico
100
99
100
1.00
72
71
74
1.03
Nicaragua
93
93
94
1.01
Panama
99
99
98
0.99
Argentina
..
..
..
..
-1
-1
Bolivia (Plurinational State of)
-1
Brazil Chile
-1
Colombia Ecuador Falkland Islands (Malvinas)
-1
95
95
95
1.01
95
96
94
0.98
95
95
94
0.99
94
93
94
1.00
99
..
..
..
..
..
..
..
**
-1 **
45
42
48
1.16
66
63
69
1.10
79
75
84
1.12
70
70
70
0.99
82
78
85
1.10
85
84
87
1.03
71
68
75
1.09
62
61
62
1.03
..
..
..
..
129