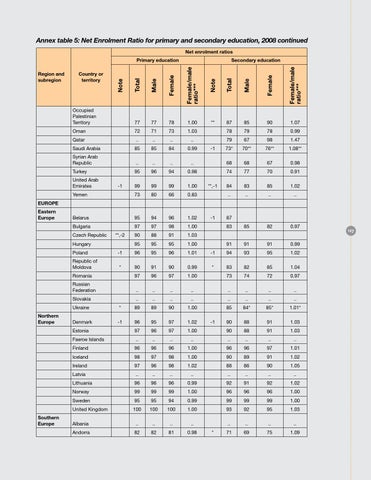
Annex table 5: Net Enrolment Ratio for primary and secondary education, 2008 continued Net enrolment ratios Primary education Region and subregion
Secondary education
Country or territory
Occupied Palestinian Territory
77
77
78
1.00
87
85
90
1.07
Oman
72
71
73
1.03
78
79
78
0.99
Qatar
..
..
..
..
79
67
98
1.47
73*
70**
76**
1.08**
**
Saudi Arabia
85
85
84
0.99
Syrian Arab Republic
..
..
..
..
68
68
67
0.98
Turkey
95
96
94
0.98
74
77
70
0.91
99
99
99
1.00
84
83
85
1.02
Yemen
73
80
66
0.83
..
..
..
..
Belarus
95
94
96
1.02
83
85
82
0.97
91
91
91
0.99
United Arab Emirates
-1
-1
**,-1
EUROPE Eastern Europe
Bulgaria Czech Republic
**,-2
Hungary
Southern Europe
97
98
1.00
88
91
1.03
95
95
95
1.00
87
Poland
-1
96
95
96
1.01
-1
94
93
95
1.02
Republic of Moldova
*
90
91
90
0.99
*
83
82
85
1.04
Romania
97
96
97
1.00
73
74
72
0.97
Russian Federation
..
..
..
..
..
..
..
..
Slovakia Northern Europe
97 90
-1
..
..
..
..
..
..
..
..
Ukraine
*
89
89
90
1.00
85
84*
85*
1.01*
Denmark
-1
96
95
97
1.02
90
88
91
1.03
Estonia
97
96
97
1.00
90
88
91
1.03
Faeroe Islands
..
..
..
..
..
..
..
..
-1
Finland
96
96
96
1.00
96
96
97
1.01
Iceland
98
97
98
1.00
90
89
91
1.02
Ireland
97
96
98
1.02
88
86
90
1.05
Latvia
..
..
..
..
..
..
..
..
Lithuania
96
96
96
0.99
92
91
92
1.02
Norway
99
99
99
1.00
96
96
96
1.00
Sweden
95
95
94
0.99
99
99
99
1.00
United Kingdom
100
100
100
1.00
93
92
95
1.03
Albania
..
..
..
..
..
..
..
..
Andorra
82
82
81
0.98
71
69
75
1.09
*
127