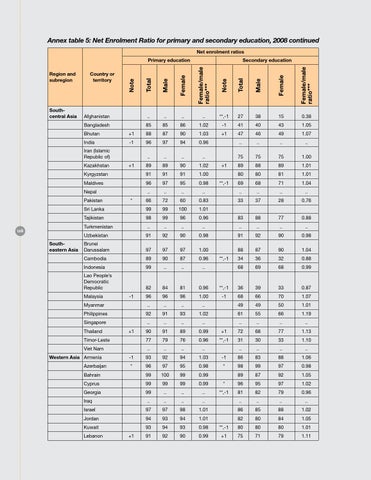
Annex table 5: Net Enrolment Ratio for primary and secondary education, 2008 continued Net enrolment ratios Primary education Region and subregion
Southcentral Asia
Country or territory
Afghanistan
..
Bangladesh
..
..
**,-1
27
38
15
0.38
85
85
86
1.02
-1
41
40
43
1.05
+1
88
87
90
1.03
+1
47
46
49
1.07
India
-1
96
97
94
0.96
..
..
..
..
..
..
..
..
75
75
75
1.00
Kazakhstan
89
89
90
1.02
Kyrgyzstan
91
91
91
1.00
Maldives
96
97
95
0.98
Nepal
..
..
..
..
66
72
60
0.83
Pakistan
Southeastern Asia
..
Bhutan Iran (Islamic Republic of)
126
Secondary education
+1
*
Sri Lanka
99
99
100
1.01
Tajikistan
98
99
96
0.96
+1 **,-1
89
88
89
1.01
80
80
81
1.01
69
68
71
1.04
..
..
..
..
33
37
28
0.76
83
88
77
0.88
Turkmenistan
..
..
..
..
..
..
..
..
Uzbekistan
91
92
90
0.98
91
92
90
0.98
Brunei Darussalam
97
97
97
1.00
88
87
90
1.04
Cambodia
89
90
87
0.96
Indonesia
99
..
..
..
Lao People’s Democratic Republic
82
84
81
0.96
**,-1 -1
Malaysia
34
36
32
0.88
68
69
68
0.99
36
39
33
0.87
96
96
96
1.00
68
66
70
1.07
Myanmar
..
..
..
..
49
49
50
1.01
Philippines
92
91
93
1.02
61
55
66
1.19
Singapore
..
..
..
..
..
..
..
..
90
91
89
0.99
+1
72
68
77
1.13
Timor-Leste
77
79
76
0.96
**,-1
31
30
33
1.10
Viet Nam
..
..
..
..
..
..
..
..
-1
93
92
94
1.03
-1
86
83
88
1.06
*
96
97
95
0.98
*
98
99
97
0.98
99
100
99
0.99
89
87
92
1.05
Cyprus
99
99
99
0.99
*
96
95
97
1.02
Georgia
99
..
..
..
**,-1
81
82
79
0.96
Thailand
Western Asia Armenia Azerbaijan
-1
**,-1
+1
Bahrain
Iraq
..
..
..
..
..
..
..
..
Israel
97
97
98
1.01
86
85
88
1.02
Jordan
94
93
94
1.01
82
80
84
1.05
Kuwait Lebanon
+1
93
94
93
0.98
**,-1
80
80
80
1.01
91
92
90
0.99
+1
75
71
79
1.11