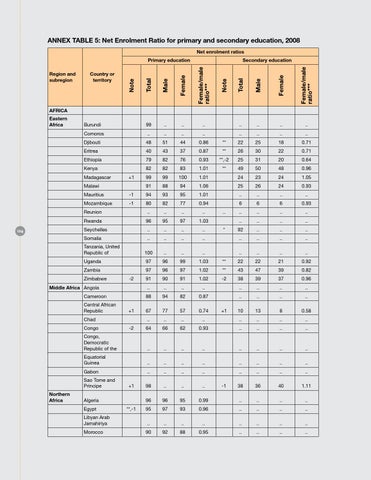
Annex table 5: Net Enrolment Ratio for primary and secondary education, 2008 Net enrolment ratios Primary education Region and subregion
Secondary education
Country or territory
AFRICA Eastern Africa
Burundi
99
..
..
..
..
..
..
..
Comoros
..
..
..
..
..
..
..
..
Djibouti
48
51
44
0.86
22
25
18
0.71
Eritrea
40
43
37
0.87
**
26
30
22
0.71
Ethiopia
79
82
76
0.93
**,-2
25
31
20
0.64
**
Kenya Madagascar
+1
Malawi
124
82
82
83
1.01
49
50
48
0.96
99
99
100
1.01
24
23
24
1.05
91
88
94
1.06
25
26
24
0.93
Mauritius
-1
94
93
95
1.01
..
..
..
..
Mozambique
-1
80
82
77
0.94
6
6
6
0.93
Reunion
..
..
..
..
Rwanda
96
95
97
1.03
Seychelles
..
..
..
..
Somalia
.. *
..
..
..
..
..
..
..
..
92
..
..
..
..
..
..
..
..
..
..
..
Tanzania, United Republic of
100
..
..
..
..
..
..
..
Uganda
97
96
99
1.03
22
22
21
0.92
Zambia Zimbabwe
-2
Middle Africa Angola Cameroon Central African Republic
+1
Chad Congo
-2
**
97
96
97
1.02
**
43
47
39
0.82
91
90
91
1.02
-2
38
39
37
0.96
..
..
..
..
..
..
..
..
88
94
82
0.87
..
..
..
..
67
77
57
0.74
10
13
8
0.58
..
..
..
..
..
..
..
..
+1
64
66
62
0.93
..
..
..
..
Congo, Democratic Republic of the
..
..
..
..
..
..
..
..
Equatorial Guinea
..
..
..
..
..
..
..
..
Gabon
..
..
..
..
..
..
..
..
98
..
..
..
38
36
40
1.11
96
96
95
0.99
..
..
..
..
Sao Tome and Principe Northern Africa
**
+1
Algeria Egypt
**,-1
-1
95
97
93
0.96
..
..
..
..
Libyan Arab Jamahiriya
..
..
..
..
..
..
..
..
Morocco
90
92
88
0.95
..
..
..
..