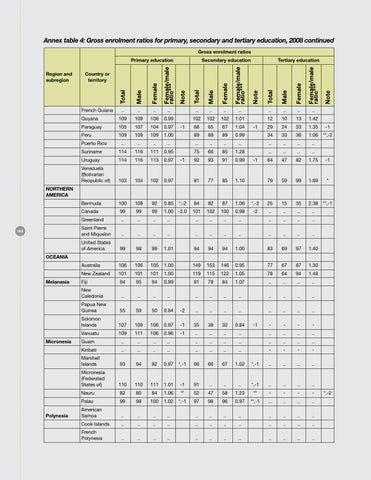
Annex table 4: Gross enrolment ratios for primary, secondary and tertiary education, 2008 continued Gross enrolment ratios Primary education Region and subregion
Secondary education
Tertiary education
Country or territory
French Guiana Guyana
..
..
..
..
..
..
..
..
..
..
..
..
109
109
108
0.99
102
102
102
1.01
12
10
13
1.42
Paraguay
105
107
104
0.97
66
65
67
1.04
29
24
33
1.35
-1
Peru
109
109
109
1.00
89
89
89
0.99
34
33
36
1.06
**,-2
..
..
..
..
..
..
..
..
..
..
..
..
Puerto Rico Suriname
114
116
111
0.95
Uruguay
114
116
113
0.97
Venezuela (Bolivarian Reopublic of)
103
104
102
0.97
Bermuda
100
108
92
0.85
-1
-1
75
66
85
1.28
92
93
91
0.99
81
77
85
1.10
*,-2
84
82
87
1.06
*,-2
1.00 -2.0
-2
-1
-1
..
..
..
..
64
47
82
1.75
-1
79
59
99
1.69
*
25
15
35
2.38
**,-1
NORTHERN AMERICA
122
Canada
99
99
99
101
102
100
0.98
..
..
..
..
Greenland
..
..
..
..
..
..
..
..
..
..
..
..
Saint Pierre and Miquelon
..
..
..
..
..
..
..
..
..
..
..
..
United States of America
99
98
99
1.01
94
94
94
1.00
83
69
97
1.40
OCEANIA
Melanasia
Micronesia
Polynesia
Australia
106
106
105
1.00
149
153
146
0.95
77
67
87
1.30
New Zealand
101
101
101
1.00
119
115
122
1.05
78
64
94
1.48
Fiji
94
95
94
0.99
81
78
84
1.07
..
..
..
..
New Caledonia
..
..
..
..
..
..
..
..
..
..
..
..
Papua New Guinea
55
59
50
0.84
-2
..
..
..
..
..
..
..
..
Solomon Islands
107
109
106
0.97
-1
35
38
32
0.84
-
-
-
-
Vanuatu
-1
-1
109
111
106
0.96
..
..
..
..
..
..
..
..
Guam
..
..
..
..
..
..
..
..
..
..
..
..
..
..
..
..
-
-
-
-
66
66
67
1.02
*,-1
..
..
..
..
Kiribati
..
..
..
..
Marshall Islands
93
94
92
0.97
*,-1
Micronesia (Federated States of)
110
110
111
1.01
-1
91
..
..
..
*,-1
..
..
..
..
Nauru
82
80
84
1.06
**
52
47
58
1.23
**
-
-
-
-
Palau
99
98
100
1.02
*,-1
97
98
96
0.97
**,-1
‌
..
..
..
American Samoa
..
..
..
..
..
..
..
..
..
..
..
..
Cook Islands
..
..
..
..
..
..
..
..
..
..
..
..
French Polynesia
..
..
..
..
..
..
..
..
..
..
..
..
*,-2